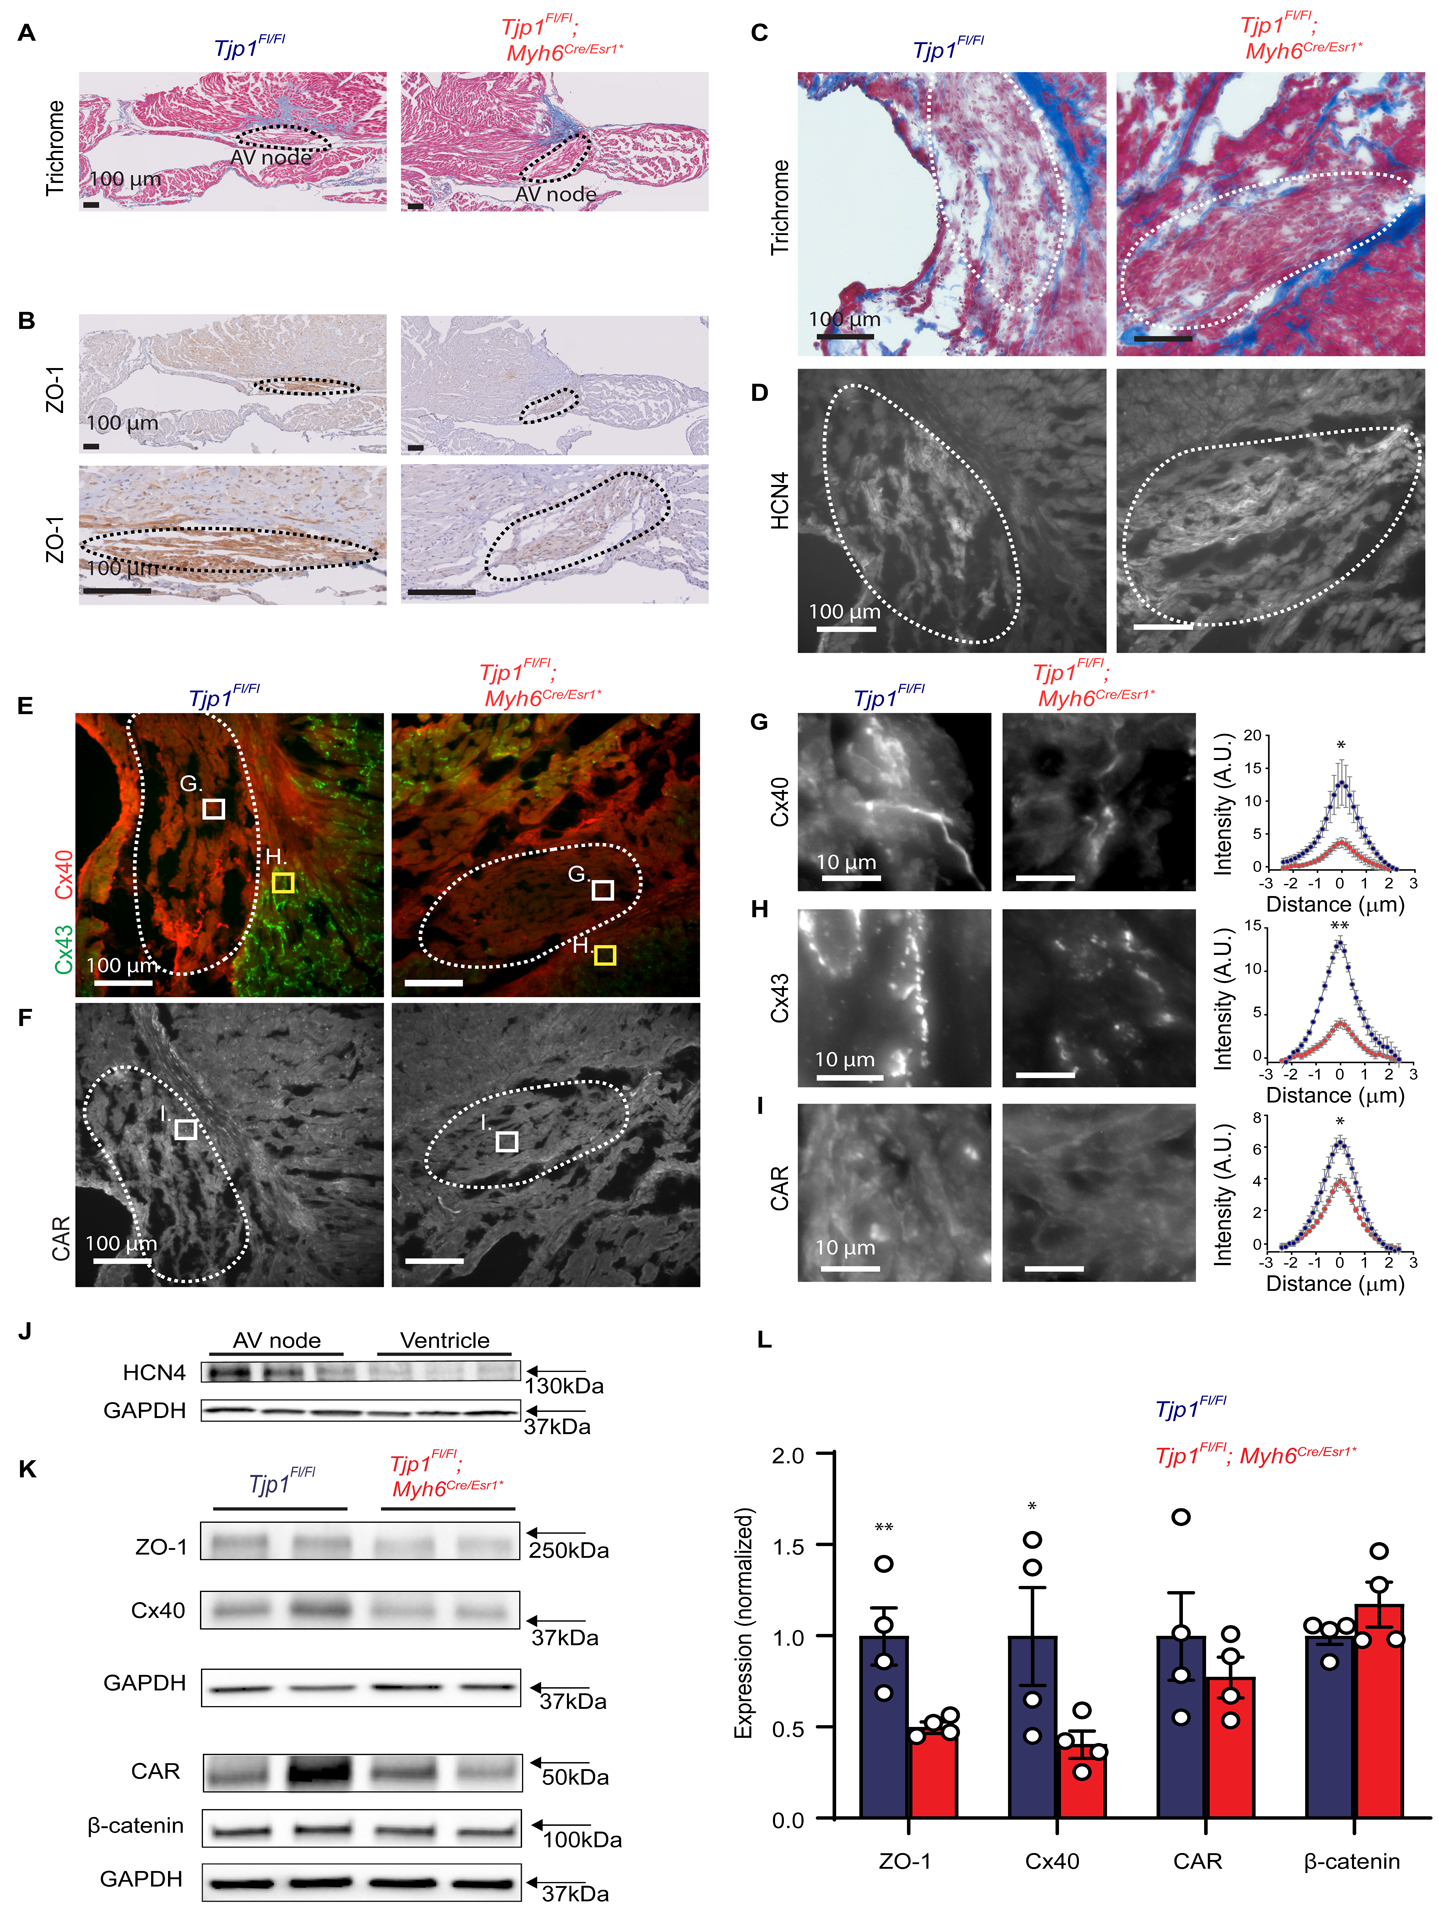
Figure 4: ZO-1 loss disrupts AV node protein localization and abundance.

A. Representative trichrome stain of mouse AV nodes. B. Representative immunohistochemical staining for ZO-1 in AV nodes (Low and high magnification images of the same AV node). C-D. Representative trichrome (C) and HCN4 immunofluorescent (D) staining for AV node identification. E-F. Immunofluorescent staining of Cx40 (E), Cx43 (E), and CAR (F) at low power (scale bar=100 μm). G-I. Representative high power images from boxed region of images in E-F (Cx40 in panel G, within AV node, Cx43 in panel H, in perinodal area, CAR in panel I, within AV node, scale bar=10 μm) and quantification of intercalated disc staining of Cx40 (G, within AV node), Cx43 (G, perinodal area), and CAR (I, within AV node). Quantification of immunofluorescent staining along lines perpendicular to the intercalated disc are shown. Peak intercalated disc intensity values were averaged per animal and compared (p=0.050 for Cx40, p=0.0018 for Cx43, and p=0.011 for CAR,WRS: p=0.050 for all, n=3 mice per genotype, 8 intercalated disc region measurements per mouse). AV nodes are circled by dashed lines. J. Western blot images of HCN4 expression in AV node tissues compared to ventricular tissue in the same Tjp1fl/fl mice (n=3 mice). K. Representative western blot images of AV node ZO-1, Cx40, CAR, and β-catenin and corresponding GAPDH loading control. L. Quantification of western blot (p=0.0089 , WRS: p=0.014 with a 95% confidence interval of 100±24% (Tjp1fl/fl) and 50±8%(Tjp1fl/fl; Myh6Cre/Esr1*) for ZO-1 , p=0.039, WRS: p=0.029 with a 95% confidence interval of 100±42%(Tjp1fl/fl) and 41±28%(Tjp1fl/fl; Myh6Cre/Esr1*) for Cx40, n=4 mice per genotype) (Red: Tjp1fl/fl; Myh6Cre/Esr1*, Blue: Tjp1fl/fl, ***p<0.001, ** p<0.01, *p<0.05. All studies were performed 10 d post-tamoxifen injection. Peak intercalated disc intensity two-tailed Student’s t-test was used to calculate p-values from immunofluorescence experiments and one-tailed Student’s t-test was used to test our hypothesis in the western blots that ZO-1 and Cx40 were decreased in Tjp1fl/fl; Myh6Cre/Esr1*.
