
Fig. 1. Properties of SVs across human populations.
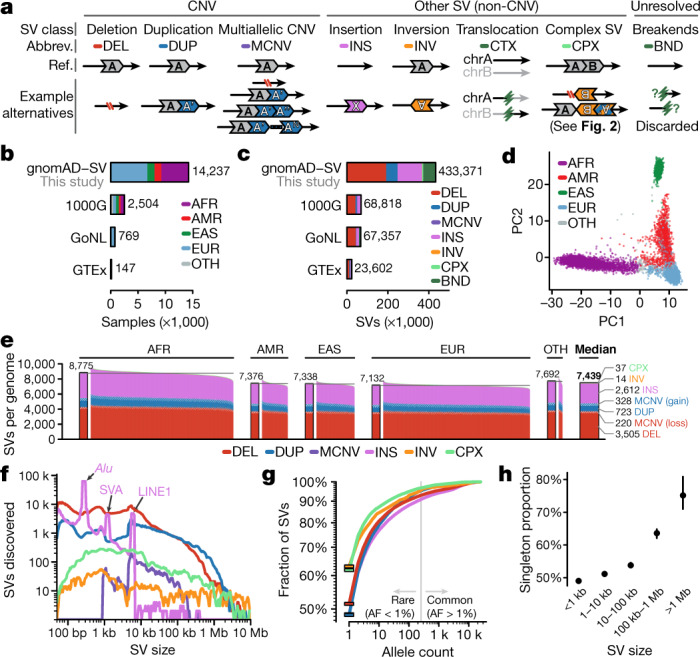
a, SV classes catalogued in this study. We also documented unresolved non-reference ‘breakends’ (BNDs), but they were excluded from all analyses as low-quality variants. b, After quality control, we analysed 14,237 samples across continental populations, including African/African American (AFR), Latino (AMR), East Asian (EAS), and European (EUR), or other populations (OTH). Three publicly available WGS-based SV datasets are provided for comparison (1000 Genomes Project (1000G), approximately 7× coverage; Genome of the Netherlands Project (GoNL), around 13× coverage; Genotype-Tissue Expression Project (GTEx), approximately 50× coverage)1,16,17. c, We discovered 433,371 SVs, and provide counts from previous studies for comparison1,16,17. d, A principal component (PC) analysis of genotypes for 15,395 common SVs separated samples along axes corresponding to genetic ancestry. e, The median genome contained 7,439 SVs. f, Most SVs were small. Expected Alu, SVA and LINE1 mobile element insertion peaks are marked at approximately 300 bp, 2.1 kb and 6 kb, respectively. g, Most SVs were rare (allele frequency (AF) < 1%), and 49.8% of SVs were singletons (solid bars). h, Allele frequencies were inversely correlated with SV size across all 335,470 resolved SVs in unrelated individuals. Values are mean and 95% confidence interval from 100-fold bootstrapping. Colour codes are consistent between a, c, e–h, and between b and d.