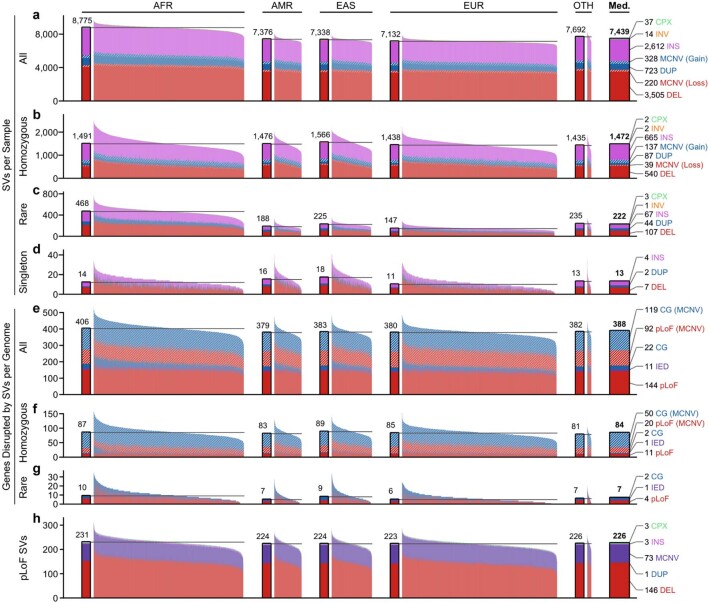
Extended Data Fig. 4. SVs contribute a substantial burden of rare, homozygous, and coding mutations per genome.
a–d, Counts of SVs per genome across a variety of parameters, corresponding to median counts of total SVs (a), homozygous SVs (b), rare SVs (c) and singleton SVs (d). Samples are grouped by population and coloured by SV types. The solid bar to the left of each population indicates the population median. e–g, Median counts of genes disrupted by SVs per genome when considering all SVs (including MCNVs) (e), homozygous SVs (including MCNVs) (f), and rare SVs (g). Colours correspond to predicted functional consequence. h, Counts of pLoF SVs per genome. For certain categories, such as genes disrupted by rare SVs per genome, a subset of samples (<5%) were enriched above the population average, as expected for individuals carrying large, rare CNVs predicted to cause the disruption of dozens or hundreds of genes (see Extended Data Fig. 1); for the purposes of visualization, the y axis for all panels has been restricted to a maximum of three interquartile ranges above the third quartile across all samples for each category.

