
Fig. 5. Dosage sensitivity in the noncoding genome.
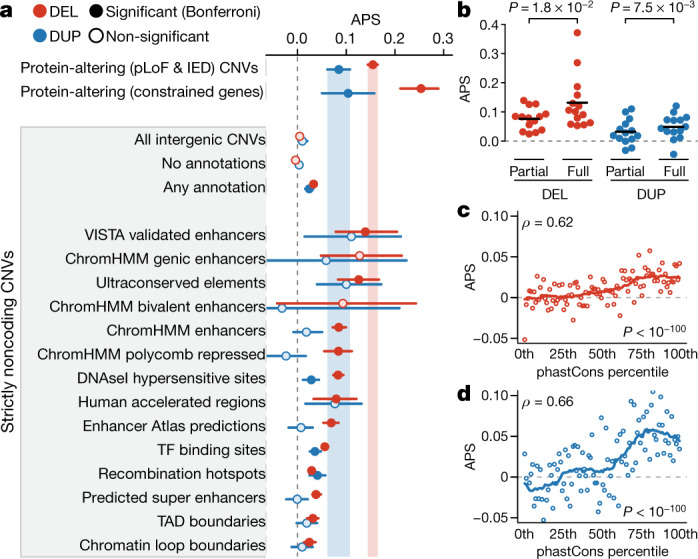
a, Strength of selection (APS) for noncoding CNVs overlapping 14 categories of noncoding elements (Supplementary Table 5). Bars reflect 95% confidence intervals from 100-fold bootstrapping. Each category was compared to neutral variation (APS = 0) using a one-tailed t-test. Categories surpassing Bonferroni-corrected significance for 32 comparisons are indicated with dark shaded points. SVs per category listed in Supplementary Table 9. DEL, deletion; DUP, duplication; TAD, topologically associating domain; TF, transcription factor. b, CNVs that completely covered elements (‘full’) had significantly higher average APS values than CNVs that only partially covered elements (‘partial’). P values calculated using a two-tailed paired two-sample t-test for the 14 categories from a. c, d, Spearman correlations between sequence conservation and APS for noncoding deletions (n = 143,353) (c) and duplications (n = 30,052) (d). Noncoding CNVs were sorted into 100-percentile bins based on the sum of the phastCons scores overlapped by the CNV. Correlations were assessed with a two-sided Spearman correlation test. Solid lines represent 21-point rolling means.