
Fig. 6. gnomAD-SV as a resource for clinical WGS interpretation.
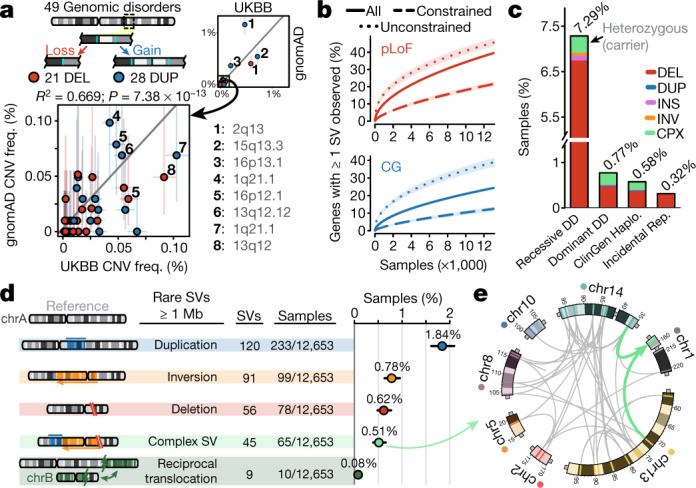
a, Comparison of carrier frequencies for 49 putatively disease-associated deletions (red) and duplications (blue) at genomic disorder loci between gnomAD-SV and microarray analyses in the UK Biobank (UKBB)38. Light bars indicate binomial 95% confidence intervals. Solid grey line represents linear best fit. b, At least one pLoF or copy-gain SV was detected in 36.9% and 23.7% of all autosomal genes, respectively. ‘Constrained’ and ‘unconstrained’ includes the least and most constrained 15% of all genes based on LOEUF4, respectively. c, Carrier rates for very rare (allele frequency < 0.1%) pLoF SVs in medically relevant genes across several gene lists7,39,44. SVs per category listed in Supplementary Table 9. d, Carrier rates for very large (≥1 Mb) rare autosomal SVs among 12,653 genomes. Bars represent binomial 95% confidence intervals. e, A complex SV involving at least 49 breakpoints and seven chromosomes (also see Extended Data Fig. 8). Teal arrows indicate insertion point into chromosome 1.