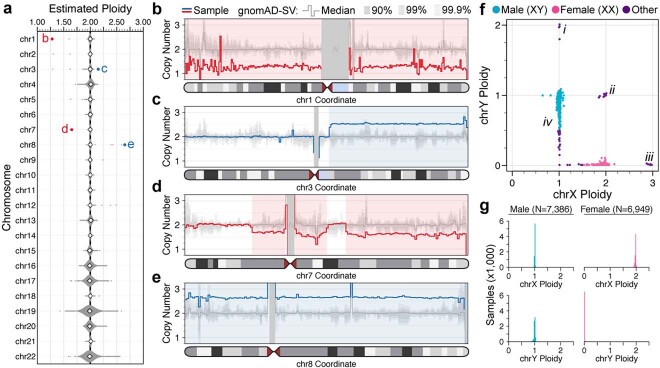
Extended Data Fig. 1. Detection of chromosome-scale dosage alterations.
We estimated ploidy (that is, whole-chromosome copy number) for all 24 chromosomes per sample. a, Distribution of autosome ploidy estimates across 14,378 samples passing initial data quality thresholds. White diamonds indicate medians. Individual points are outlier samples at least three standard deviations away from the cohort-wide mean. The outlier points marked in red and blue correspond to the samples highlighted in b–e. b–e, Samples with outlier autosome ploidy estimates typically contained somatic or mosaic chromosomal abnormalities, such as somatic aneuploidy of chromosome 1 (chr1) (b) or chromosome 8 (e), or large focal somatic or mosaic CNVs on chromosome 3 (c) and chromosome 7 (d). Each panel depicts copy-number estimates in 1-Mb bins for each rearranged sample in red or blue. Dark, medium and light-grey background shading indicates the range of copy number estimates for 90%, 99% and 99.9% of all gnomAD-SV samples, respectively, and the medium grey line indicates the median copy number estimate across all samples. Regions of unalignable N-masked bases >1 Mb in the reference genome are masked with grey rectangles. f, Sex chromosome ploidy estimates for all samples from a. We inferred karyotypic sex by clustering samples to their nearest integer ploidy for sex chromosomes. Several abnormal sex chromosome ploidies are marked, including XYY (i), XXY (ii), XXX (iii), and mosaic loss-of-Y (iv). g, Histogram representation of the data from f. Essentially all samples conformed to canonical sex chromosome ploidies.

