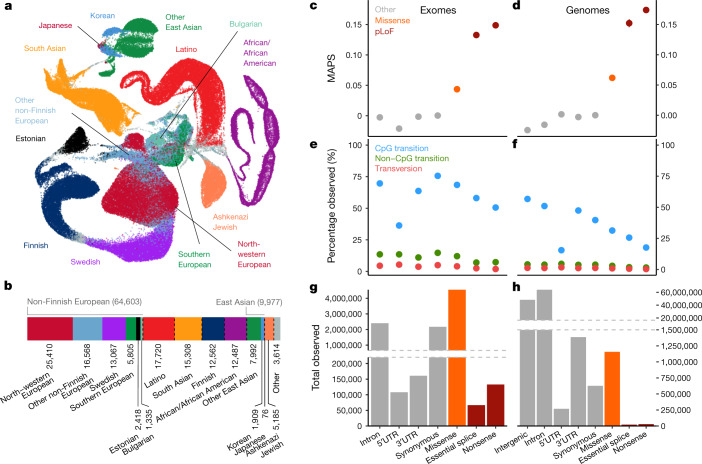
Fig. 1. Aggregation of 141,456 exome and genome sequences.
a, Uniform manifold approximation and projection (UMAP)46,47 plot depicting the ancestral diversity of all individuals in gnomAD, using seven principal components. Note that long-range distances in the UMAP space are not a proxy for genetic distance. b, The number of individuals by population and subpopulation in the gnomAD database. Colours representing populations in a and b are consistent. c, d, The mutability-adjusted proportion of singletons4 (MAPS) is shown across functional categories for SNVs in exomes (c; x axis shared with e and g) and genomes (d; x axis shared with f and h). Higher values indicate an enrichment of lower frequency variants, which suggests increased deleteriousness. e, f, The proportion of possible variants observed for each functional class for each mutational type for exomes (e) and genomes (f). CpG transitions are more saturated, except where selection (for example, pLoFs) or hypomethylation (5′ untranslated region) decreases the number of observations. g, h, The total number of variants observed in each functional class for exomes (g) and genomes (h). Error bars in c–f represent 95% confidence intervals (note that in some cases these are fully contained within the plotted point).

