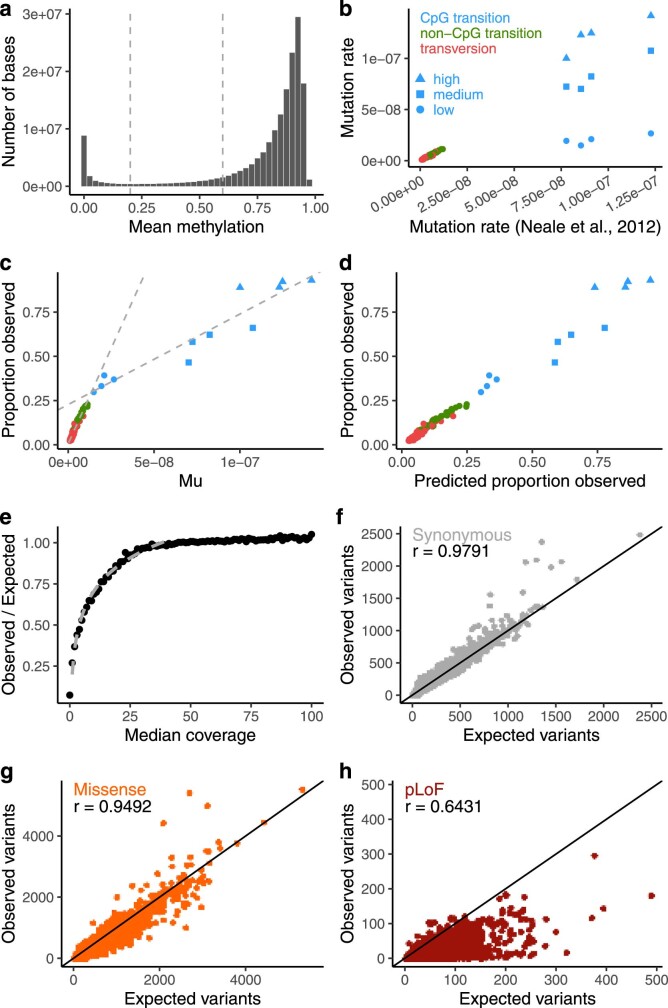
Extended Data Fig. 6. Computing the depletion of variation of functional categories.
a, The distribution of mean methylation values across 37 tissues and across every CpG dinucleotide in the genome. We divided the genome into 3 levels (low methylation, missing or < 0.2; medium, 0.2–0.6; and high, >0.6) and computed all ensuing metrics based on these categories. b, Comparison of estimates of the mutation rate with previous estimates52. For transversions and non-CpG transitions, we observe a strong correlation (linear regression r = 0.98; P = 2.6 × 10−65). For CpG transitions, the new estimates are calculated separately for the three levels of methylation and track with these levels. Colours and shapes are consistent in b–d. c, For c–e, only synonymous variants are considered. The proportion of possible variants observed for each context is correlated with the mutation rate. We compute two fit lines, one for CpG transitions, and one for other contexts to calibrate our estimates. d, Calibration of each context to compute a predicted proportion observed after fitting the two models in c, which is used to calculate an expected number of variants at high coverage. e, With an expectation computed from high coverage regions, the observed/expected ratio follows a logarithmic trend with the median coverage below 40×, which is used to correct low coverage bases in the final expectation model. f–h, For each transcript, the observed number of variants is plotted against the expected number from the model described above, for synonymous (f), missense (g), and pLoF (h) variants, and the linear regression coefficient is shown. Note that the expectation does not include selection, and so, pLoF and, to a lesser extent, missense variants exhibit lower observed values than expected.

