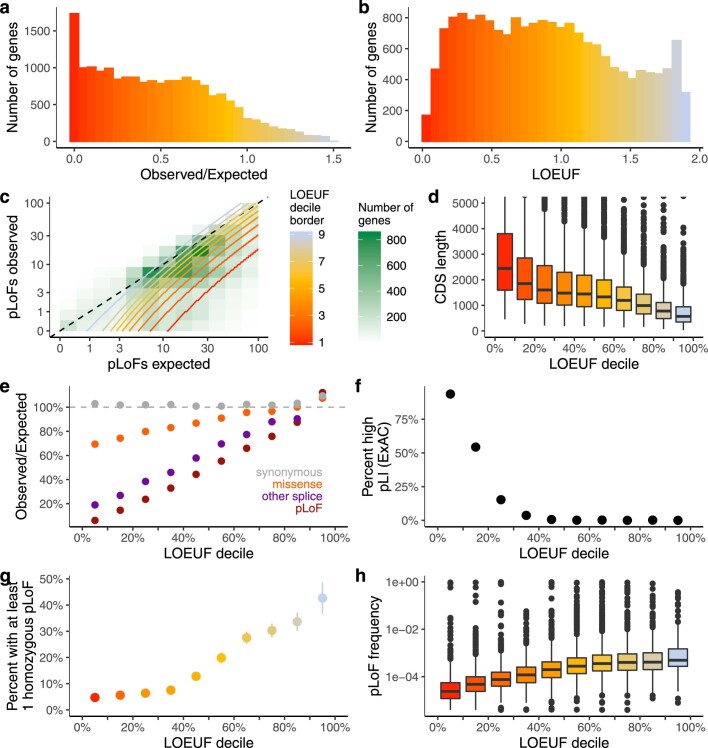
Extended Data Fig. 7. Genomic properties of constrained genes.
a, b, Histogram of the observed/expected ratio of pLoF variation (a) and LOEUF (b). Most genes have fewer observed variants than expected (median observed/expected = 0.48), and the genes with no observed pLoFs are distinguished between confidently constrained genes and noise by LOEUF. c, A 2D density plot of the number of observed versus expected pLoF variants. The boundaries of each decile are plotted as gradients (that is, the most constrained decile is below the lowest red line). d, The LOEUF of a gene is correlated with its coding sequence length (beta = −1.07 × 10⁻⁴; P < 10−100): thus, for all downstream statistical tests, we adjust for gene length or remove genes with fewer than 10 expected pLoFs. e, Observed/expected ratios of various functional classes across genes within each LOEUF decile. The most constrained decile has approximately 6% of the expected pLoFs, while synonymous variants are not depleted and missense variants exhibit modest depletion. f, The percentage of each LOEUF decile that was described in ExAC as constrained, or pLI > 0.94. g, The percentage of each LOEUF decile that have at least one homozygous pLoF variant. h, Box plots of the aggregate pLoF frequency for each LOEUF decile. Centre line denotes the median; box limits denote upper and lower quartiles; whiskers denote 1.5× the interquartile range; points denote outliers). In e–g, error bars represent 95% confidence intervals (note that in some cases these are fully contained within the plotted point).

