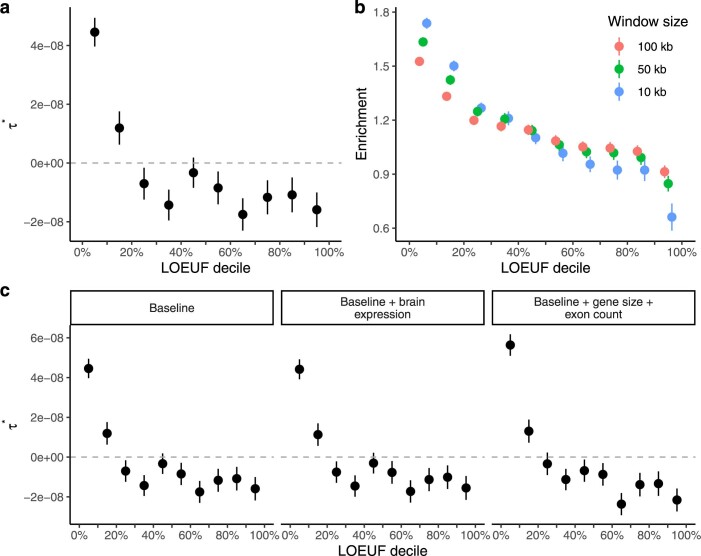
Extended Data Fig. 10. Applications of constraint metrics to common variant analysis of disease.
a, The coefficient (see Supplementary Information) for each LOEUF decile across 276 independent traits. Unlike the enrichment measure reported in Fig. 5, is adjusted for 74 baseline genomics annotations. Positive values of indicate greater per-SNP heritability than would be expected based on the other annotations in the baseline model, whereas negative values indicate depleted per-SNP heritability compared to that baseline expectation. b, Enrichment coefficient for each LOEUF decile using different window sizes to define which SNPs to include upstream and downstream of each gene. c, Enrichment coefficient for each LOEUF decile across traits after controlling for brain expression and gene size. Results are consistent with those shown in Fig. 5, which indicates that brain gene expression and gene size do not fully explain the enrichment of heritability observed in constrained genes. Error bars represent 95% confidence intervals.

