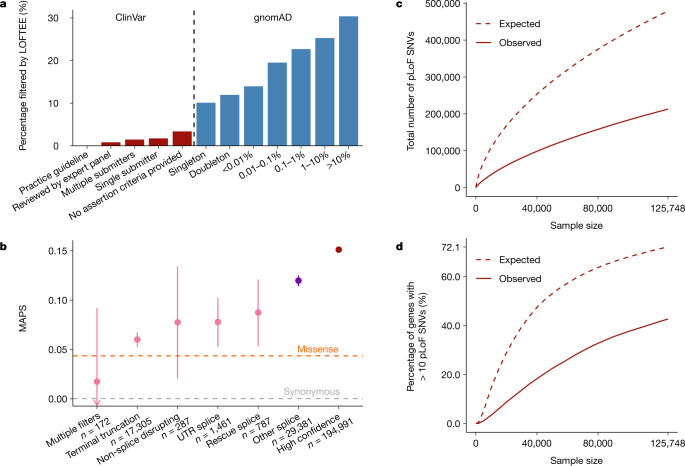
Fig. 2. Generating a high-confidence set of pLoF variants.
a, The percentage of variants filtered by LOFTEE grouped by ClinVar status and gnomAD frequency. Despite not using frequency information, LOFTEE removes a larger proportion of common variants, and a very low proportion of reported disease-causing variation. b, MAPS (see Fig. 1c, d) is shown by LOFTEE designation and filter. Variants filtered out by LOFTEE exhibit frequency spectra that are similar to those of missense variants; predicted splice variants outside the essential splice site are more rare, and high-confidence variants are very likely to be singletons. Only SNVs with at least 80% call rate are included here. Error bars represent 95% confidence intervals. c, d, The total number of pLoF variants (c), and proportion of genes with more than ten pLoF variants (d) observed and expected (in the absence of selection) as a function of sample size (downsampled from gnomAD). Selection reduces the number of variants observed, and variant discovery approximately follows a square-root relationship with the number of samples. At current sample sizes, we would expect to identify more than 10 pLoF variants for 72.1% of genes in the absence of selection.

