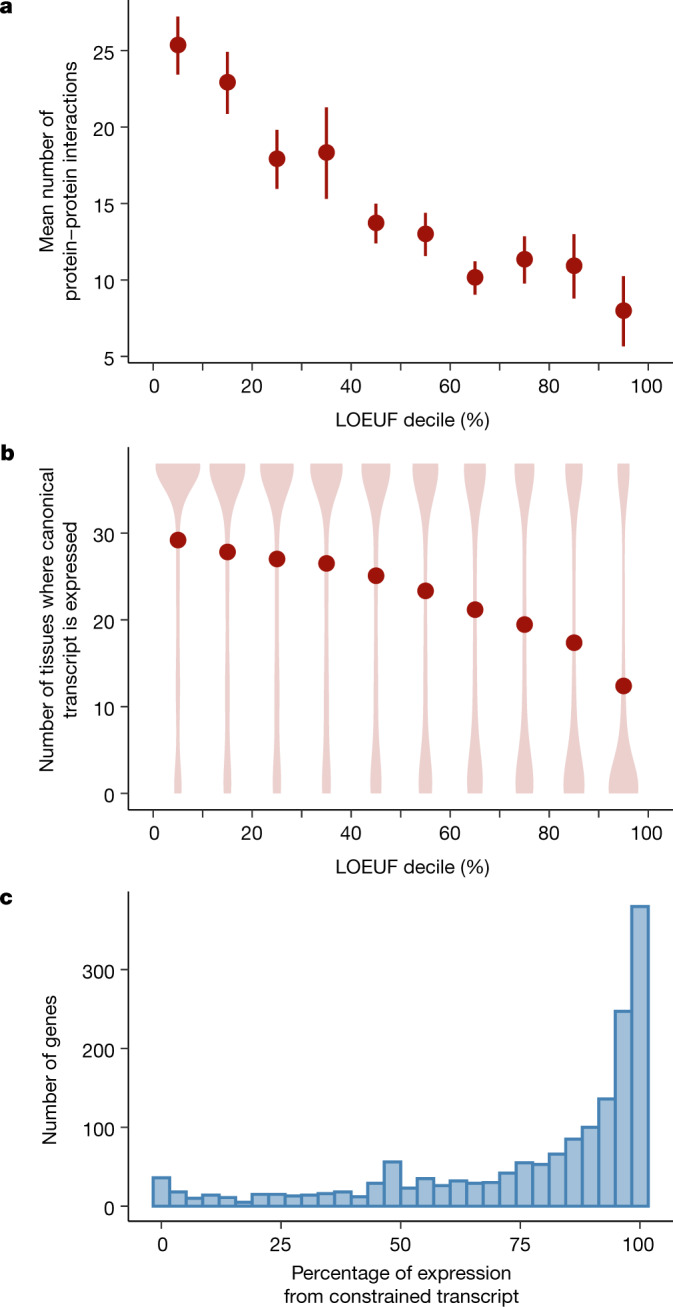
Fig. 4. Biological properties of constrained genes and transcripts.

a, The mean number of protein–protein interactions is plotted as a function of LOEUF decile: more constrained genes have more interaction partners (LOEUF linear regression r = −0.14; P = 1.7 × 10−51). Error bars correspond to 95% confidence intervals. b, The number of tissues where a gene is expressed (transcripts per million > 0.3), binned by LOEUF decile, is shown as a violin plot with the mean number overlaid as points: more constrained genes are more likely to be expressed in several tissues (LOEUF linear regression r = −0.31; P < 1 × 10−100). c, For 1,740 genes in which there exists at least one constrained and one unconstrained transcript, the proportion of expression derived from the constrained transcript is plotted as a histogram.
