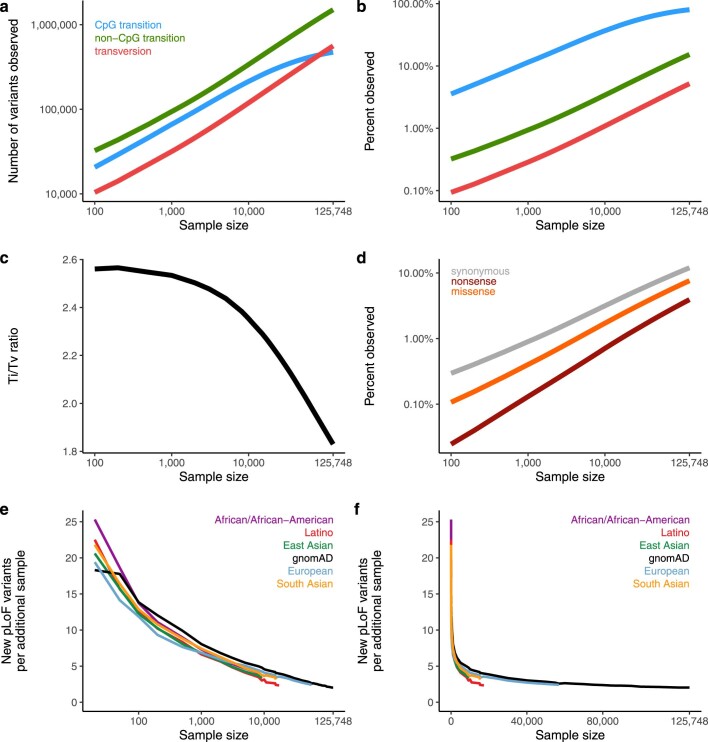
Extended Data Fig. 4. Variant discovery at large sample sizes.
a, b, The total number of variants observed (a) and the proportion of possible variants observed (b) as a function of sample size, broken down by variant class. At large sample sizes, CpG transitions become saturated, as previously described4. Colours are consistent in a and b. c, This results in a decrease of the transition/transversion (Ti/Tv) ratio. d, When broken down by functional class, we observe the effects of selection, in which synonymous variants have the highest proportion observed, followed by missense and pLoF variants. e, f, The number of additional pLoF variants introduced into the cohort as a function of sample size on a log (e) and linear (f) scale. Here, gnomAD (black) refers to a uniform sampling from the population distribution of the full cohort of exome-sequenced individuals.

