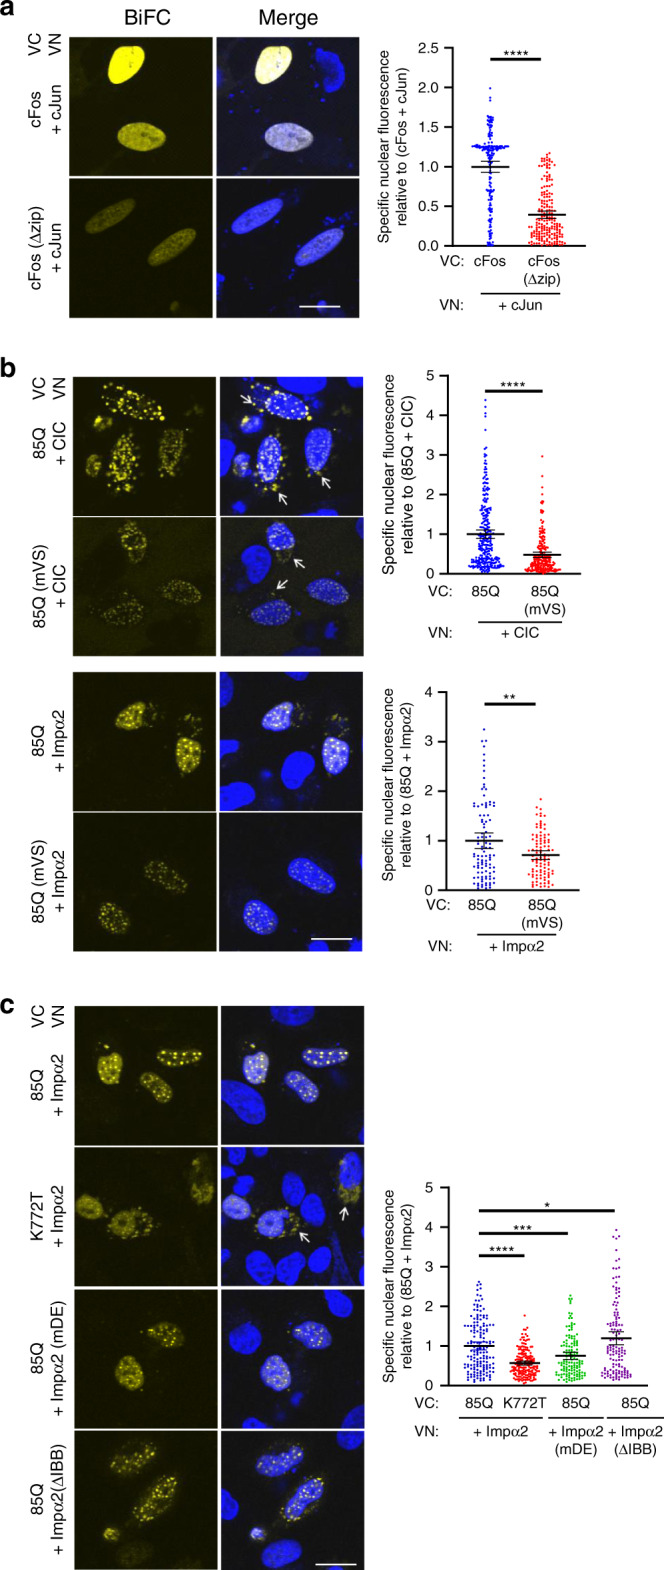
Fig. 2. Ataxin-1[85Q] interacts with nuclear transporter protein importin-α2.

Cells were transfected to express the indicated BiFC constructs. At 18 h post-infection, intracellular protein-protein interactions were assessed by quantitative imaging of the complemented Venus fluorescence (BiFC, yellow, left panels), with merge overlays of BiFC and Hoechst nuclear stain (blue) (Merge, middle panels). Arrows indicate cytoplasmic complementation of the Venus fluorescent signal. Quantitative results (graphs, right panels) for specific nuclear fluorescence complementation of Venus represent the mean ± SEM for 100–200 cell nuclei per sample assessed across three independent experiments specifically as follows: a control interaction of VN-cJun complementing with VC-cFos (positive control) or VC-cFos (Δzip) (negative control) (n = 183 and 188 nuclei per group, respectively), p < 0.00001; b control interaction of VN-CIC complementing with wild-type ataxin-1[85Q] (positive control) or the mutant ataxin-1[85Q] mVS (negative control) as well as the test interaction of VN-Impα2 complementing with VC-wild-type ataxin-1[85Q] or VC-mVS mutant ataxin-1[85Q] (n = 258, 201, 101 and 101 nuclei per group, respectively), p < 0.00001 and p = 0.00295, respectively; c test interaction of wild-type VN-Impα2 with VC-wild-type ataxin-1[85Q] or VC-nuclear accumulation deficient ataxin-1[85Q] K772T mutant (n = 155 and 172 nuclei per group) or the test interaction of VN-Impα2 mDE or ΔIBB mutants with VC-wild-type ataxin-1[85Q] (n = 131 and 131 nuclei respectively), p value from top to bottom: p = 0.04089, p = 0.00042, p < 0.00001. a–c *p < 0.05; **p < 0.01; ***p < 0.001; ****p < 0.0001 (Two-sided Student’s t test). Source data are provided as a Source Data file.
