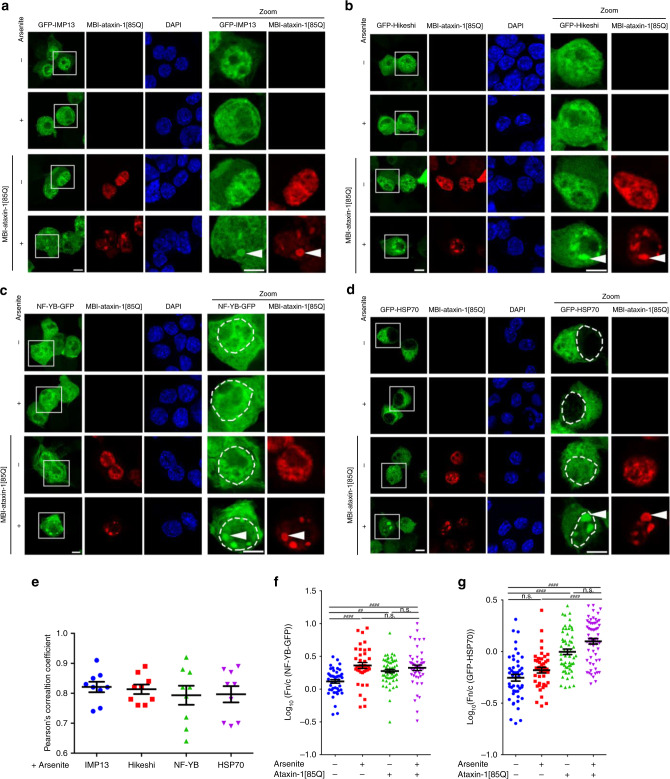
Fig. 5. Ataxin-1[85Q] alters localisation and transport activity of importin-13 and hikeshi.
Neuro-2a cells were transfected to co-express MBI-ataxin-1[85Q] with (a) GFP-Importin-13 (GFP-IMP13), (b) GFP-Hikeshi, (c) the importin-13 cargo protein NF-YB-GFP or (d) the hikeshi cargo protein GFP-HSP70. At 24 h post-transfection, cells were treated with arsenite as indicated, and then fixed, stained with anti-myc antibody and DAPI, before CLSM imaging. Representative images are shown; merge panels overlay GFP, myc, and DAPI images. Zoom images (right panels) correspond to the boxed regions; mis-localisation is denoted by the white arrowheads whereas in c, d the position of the nucleus, as determined by DAPI staining, is indicated by the white dashed lines. Scale bar = 10 μm. e Pearson’s correlation coefficients, calculated using the coloc2 plugin for localisation between fluorophores in a 25 μm2 square centred over each arsenite-induced ataxin-1 nuclear body, quantitatively assessed co-localisation of GFP-tagged proteins with ataxin-1 nuclear bodies, where 0 indicates no correlation between two channels whereas 1 indicates complete correlation of two channels. Results represent the mean ± SEM (n = 9 cells imaged across three independent experiments). f, g Integrated fluorescence intensity in nucleus and cytoplasm was estimated and the nuclear to cytoplasmic fluorescence ratio (Fn/c) determined using a modified CellProfiler pipeline. Results represent the mean log10 Fn/c ± SEM calculated across three independent experiments using the following numbers of analysed cells: −arsenite/−ataxin-1[85Q] n = 46 (f) or 47 (g), +arsenite/−ataxin-1[85Q] n = 39 (f) or 43 (g), −arsenite/+ataxin-1[85Q] = 56 (f) or 57 (g), +arsenite/+ataxin-1[85Q] n = 48 (f) or 60 (g), p value from top to bottom and left to right: f p = 0.00003, p = 0.00139, p > 0.99999, p < 0.00001, p > 0.99999, g p < 0.00001, p < 0.00001, p = 0.21628, p > 0.99999, p < 0.00001 (*p < 0.05, **p < 0.01, ****p < 0.0001, n.s. not significant, Mann–Whitney and Kruskal–Wallis non-parametric test). Source data are provided as a Source Data file.

