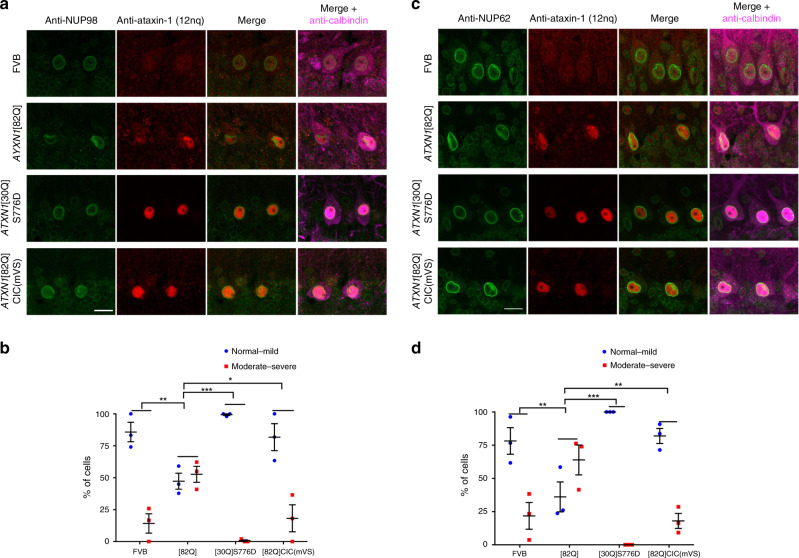
Fig. 7. Nucleoporins NUP98 and NUP62 are mislocalised in Purkinje cells in SCA1 mice.
Mice (12 weeks old) of each genotype ((FVB, ATXN1[82Q], ATXN1[30Q]S776D and ATXN1[82Q]CIC(mVS)) were anaesthetised and cerebellum sections were cut for staining and imaging. NUP98 (green), ataxin-1 (red) and calbindin (magenta, a marker of Purkinje cells) were detected by immunofluorescent staining. Merge panels a NUP98 + ataxin-1 or NUP98 + ataxin-1+calbindin and c NUP62 + ataxin-1 or NUP62 + ataxin-1+calbindin are shown. a, c Scale bars = 20 μm. b NUP98 nuclear rim staining or d NUP62 snuclear rim staining was scored as normal-mild (round to mostly round with ≤2 small to medium-sized wrinkles) or moderate-severe (elongated with large invaginations and distorted morphology) by an observer blinded to the animal genotype; results were calculated as the percentage of Purkinje cells of each type. Results represent the mean ± SEM calculated using the following numbers of analysed cells in mice: FVB n = 343 (b) or 365 (d) cells from 3 mice, [82Q] n = 291 (b) or 347 (d) cells from 3 mice, [30Q]S776D n = 290 (b) or 271 (d) cells from 3 mice, [82Q]CIC(mVS) n = 228 (b) or 182 (d) cells from 3 mice, p value (both “normal – mild” and “moderate – severe”) (b) FVB vs [82Q] = 0.00818, [82Q] vs [30Q]S776D = 0.00056, [82Q] vs [82Q]CIC(mVS) = 0.01818, (d) FVB vs [82Q] = 0.00939, [82Q] vs [30Q]S776D = 0.00020, [82Q] vs [82Q]CIC(mVS) = 0.00477 (*p < 0.05, **p < 0.01, ***p < 0.001, two-way ANOVA and Tukey’s multiple comparisons test). Source data are provided as a Source Data file.

