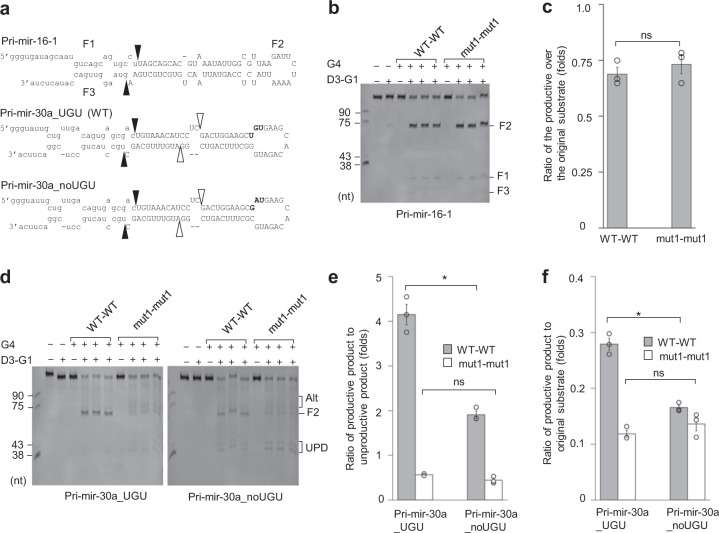
Fig. 4. Amino acids 461–463 are responsible for the accuracy and efficiency of Microprocessor cleavage.
a Diagrams of pri-mir-16-1, pri-mir-30a_UGU (WT), and pri-mir-30a_noUGU. The uppercase letters represent the pre-miRNA region. The solid black and white arrowheads indicate the productive and unproductive cleavage sites of Microprocessor, respectively. b The pri-mir-16-1 processing by Microprocessor. Pri-mir-16-1 (0.5 μM) was processed with D3–G1 (0.1 μM) and/or either G4 WT–WT (0.05 μM) or G4 mut1–mut1 (0.05 μM) for 60 min, as described in “Methods”. c Quantification of the data shown in (b). The density of each band was determined using Image Lab 6.0, and the ratio of the F2 product (pre-mir-16-1) to the original substrate (pri-mir-16-1) was calculated from three independent experiments. G4 WT–WT vs. G4 mut1–mut1: p = 0.350. d The pri-mir-30a_UGU and pri-mir-30a_noUGU processing by Microprocessor. Pri-mir-30a_UGU or pri-mir-30a_noUGU (0.5 μM) was processed by D3–G1 (0.2 μM) and/or either G4 WT–WT (0.1 μM) or G4 mut1–mut1 (0.1 μM) for 60 min, as described in “Methods”. Alt and UPD mean the alternative and unproductive cleavages, respectively. e, f Quantification of the data shown in (d). The ratio of the productive product (F2) to the unproductive product in (e), and the ratio of the productive product (F2) to the original substrate (pri-mir-30a_UGU or pri-mir-30a_noUGU) in (f), were calculated from three independent experiments. Productive product/unproductive product of pri-mir-30a_UGU vs. pri-mir-30a_noUGU for G4 WT–WT: p = 0.018 and G4 mut1–mut1: p = 0.154. Productive product/original substrate of pri-mir-30a_UGU vs. pri-mir-30a_noUGU for G4 WT–WT: p = 0.003 and G4 mut1–mut1: p = 0.182. The asterisks (*) and (ns) indicate statistically significant and nonsignificant differences, respectively, from the two-sided t test.

