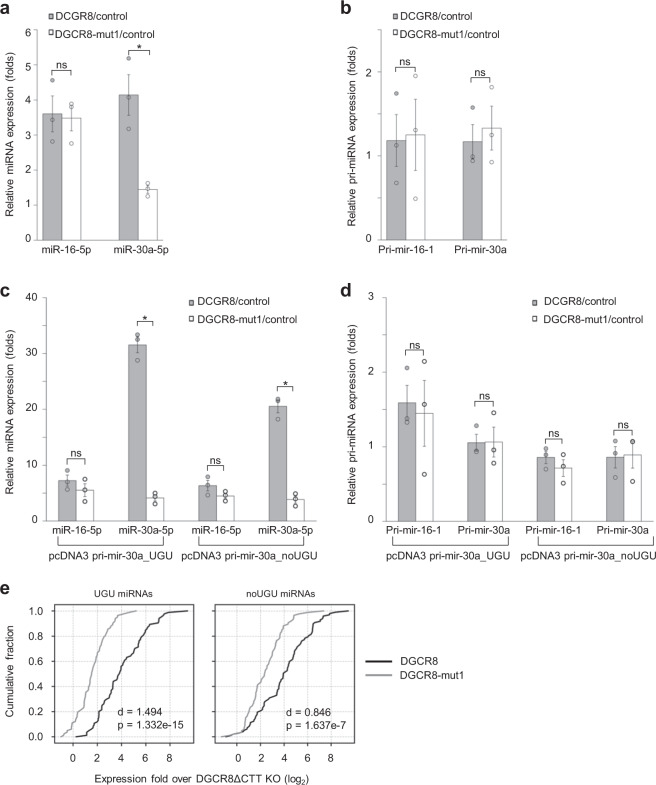
Fig. 6. Amino acids 461–463 are critical for Microprocessor processing in human cells.
a The DGCR8ΔCTT knockout (KO) cells were transfected with pCK (control), pCK-DGCR8–WT, or pCK-DGCR8–mut1. The miRNA expression of these transfected cells was estimated by qPCR as described in “Methods”. The results were obtained from three independent experiments (miR-16-5p DGCR8/control vs. miR-16-5p DGCR8–mut1/control: p = 0.857, miR-30a-5p DGCR8/control vs. miR-30a-5p DGCR8–mut1/control: p = 0.010). b The pri-miRNA expression in the transfected cells in (a) was estimated by qPCR and normalized against GAPDH. The results were obtained from three independent experiments (pri-mir-16-1 DGCR8/control vs. pri-mir-16-1 DGCR8–mut1/control: p = 0.904, pri-mir-30a DGCR8/control vs. pri-mir-30a DGCR8–mut1/control: p = 0.651). c The miR-30a expression in the DGCR8ΔCTT KO cells transfected with pCK-DGCR8–WT or mut1, pcDNA3-pri-mir-16-1, and pcDNA3-pri-mir-30a_UGU or pcDNA3-pri-mir-30a_noUGU. The results were obtained from three independent experiments (for the pcDNA3-pri-mir-30a_UGU transfected cells: miR-16-5p DGCR8–WT/control vs. miR-16-5p DGCR8–mut1/control: p = 0.322, miR-30a-5p DGCR8–WT/control vs. miR-30a-5p DGCR8–mut1/control: p = 5.5e−5; for the pcDNA3-pri-mir-30a_noUGU transfected cells: miR-16-5p DGCR8–WT/control vs. miR-16-5p DGCR8–mut1/control: p = 0.161, miR-30a-5p DGCR8–WT/control vs. miR-30a-5p DGCR8–mut1/control: p = 2.2e−4). d The expression of pri-miRNAs in the transfected cells described in (c). The pri-miRNA expression was estimated by qPCR and normalized using GAPDH. The results were obtained from three independent experiments (for the pcDNA3-pri-mir-30a_UGU transfected cells: pri-mir-16-1 DGCR8–WT/control vs. pri-mir-16-1 DGCR8–mut1/control: p = 0.792, pri-mir-30a DGCR8–WT/control vs. pri-mir-30a DGCR8–mut1/control: p = 0.968; for the pcDNA3-pri-mir-30a_noUGU transfected cells: pri-mir-16-1 DGCR8–WT/control vs. pri-mir-16-1 DGCR8–mut1/control: p = 0.364, pri-mir-30a DGCR8/control vs. pri-mir-30a DGCR8–mut1/control: p = 0.897. The asterisks (*) and (ns) indicate statistically significant and nonsignificant differences, respectively, from the two-sided t test. e The cumulative fraction of miRNA expression levels in the rescued DGCR8ΔCTT KO cells. The miRNAs were classified according to the presence of an apical UGU motif in pri-miRNAs as described in “Methods”. Cohenʼs d values were calculated between the miRNA expression levels induced by DGCR8–WT and DGCR8–mut1. The p values were calculated with the two-sided Wilcoxon rank-sum test.

