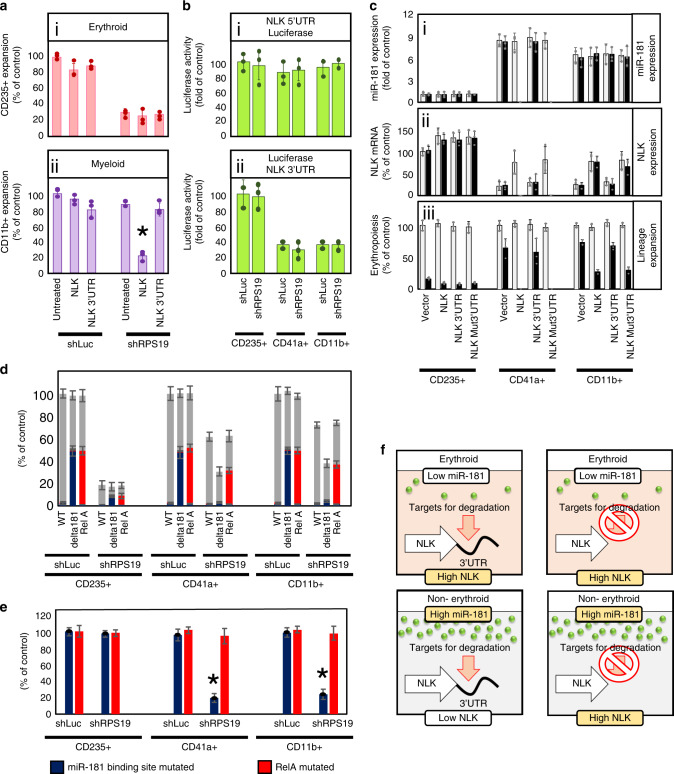
Fig. 5. Upregulation of miR181 suppresses NLK expression in non-erythroid progenitors and protects cells from RPS19-insufficiency.
a Wild type NLK cDNA was generated with or without the NLK 3′UTR. Cord blood CD34 + HSPCs were transduced with NLK construct and siRNA and differentiated for 12 days. Erythroid (i—red) and Myeloid (ii—purple) expansion was calculated by multiplying viable cell counts by % CD235+ or CD11b+, respectively. Results are displayed as a percentage of cells of each lineage relative to untreated controls. b—green CD34+ progenitors were transduced with shRNA against a non-targeting sequence (NT) or RPS19 (shRPS19) and the NLK minimal promoter upstream of the luciferase gene (i) or luciferase gene with the NLK 3’UTR downstream (ii). After 12 days of differentiation in erythroid media, cultures were sorted into designated hematopoietic lineages and luciferase activity was assessed. c CD34+ progenitors were transduced with shLuc (white bars) or shRPS19 (dark bars). In addition, vectors expressing cDNA for NLK with either a 3′UTR with 3 stop sequences (NLK stop), the wild type NLK 3′UTR (NLK WT 3’UTR) or 3′UTR with the miR181 binding site mutated (NLK Mut 3′UTR). After differentiation, cells were sorted into hematopoietic lineage and assessed for miR181 expression (i) or NLK expression (iii) by qRT-PCR. The relative number of each hematopoietic lineage was determined as a percentage of the number observed in controls expressing only endogenous NLK (iii). d After counting and sorting for lineage (gray bars), cells were sequenced to determine the percentage of cells within each population carrying indels in miR181 binding site (blue) and RelA (red). e The percentage of cells carrying indels in NLK 3′UTR miR181 binding site (blue) and RelA (red) in each treatment were further compared for impact on population expansion between lineages. f A diagrammatic representation of the induction of miR-181 in non-erythroid progenitors leads to binding to the NLK 3′UTR to facilitate degradation of the NLK transcript. Bars represent means ± SD with individual data points overlaid. n = 3 independent experiments performed in triplicate. Statistics: two-tailed Student’s t test, significant *p < 0.05.Also see Supplementary Fig. 6. Source data are provided as a Source Data file.

