Figure 1.
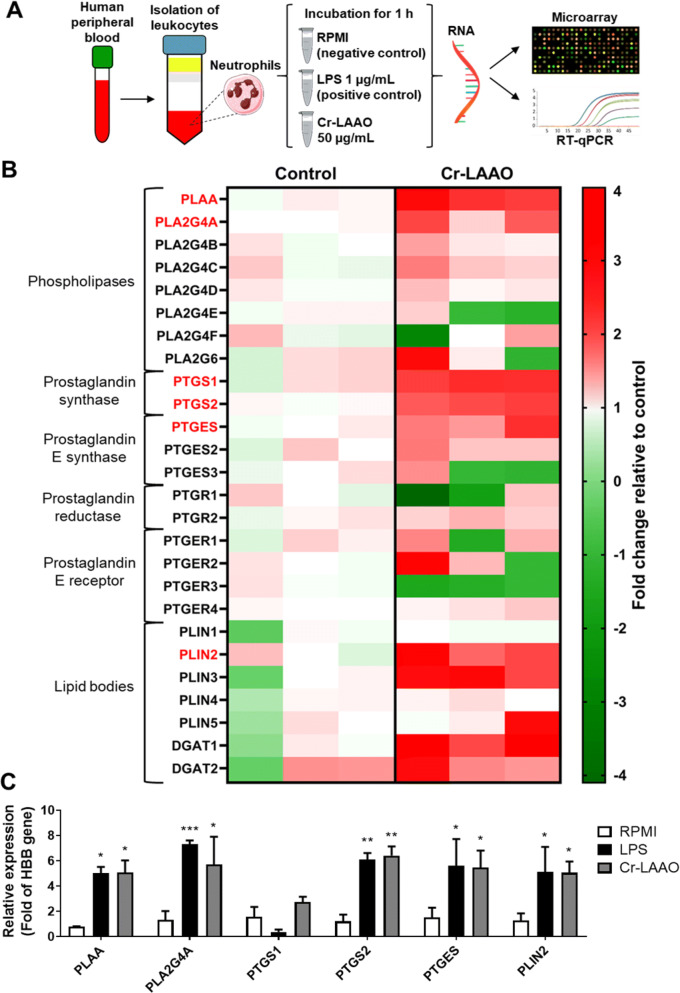
Gene expression of COX pathway. The microarray and qRT-PCR were performed with 2 × 10⁵ human neutrophils from 3 different donors, stimulated with Cr-LAAO (50 μg/mL), LPS (1 μg/mL; positive control) or RPMI (negative control) for 1 h at 37 °C and 5% CO2. This figure was created using images from Servier Medical Art Commons Attribution 3.0 Unported License (https://smart.servier.com) (A). Servier Medical Art by Servier is licensed under a Creative Commons Attribution 3.0 Unported License. The microarray fold change was represented in up regulation (red) and down regulation (green) for cells stimulated with Cr-LAAO in relation to control. The genes shown were for phospholipase A2-activating protein (PLAA), group IVA (PLA2G4A), IVB (PLA2G4B), IVC (PLA2G4C), IVD (PLA2G4D), IVE (PLA2G4E), IVF (PLA2G4F) and VI (PLA2G6) phospholipase A2, prostaglandin-endoperoxide synthase 1 (PTGS1) and 2 (PTGS2), prostaglandin E synthase 1 (PTGES), 2 (PTGES2) and 3 (PTGES3), prostaglandin reductase 1 (PTGR1) and 2 (PTGR2), prostaglandin E receptor 1 (PTGER1), 2 (PTGER2), 3 (PTGER3) and 4 (PTGER4), perilipin 1–5 (PLIN1, PLIN12, PLIN3, PLIN4 and PLIN5), diacylglycerol O-acyltransferase 1 and 2 (DGAT1 and DGAT2) (B). The genes analyzed by qRT-PCR were PLAA, PLA2G4A, PTGS1, PTGS2, PTGES and PLIN2. Hemoglobin subunit beta (HBB) was used as reference gene for normalization (C). Values are mean S.E.M. from 3 donors. *P < 0.05, **P < 0.01, ***P < 0.001, ****P < 0.0001 compared to negative control (Data were presented with ANOVA followed by Dunnett post-test).

