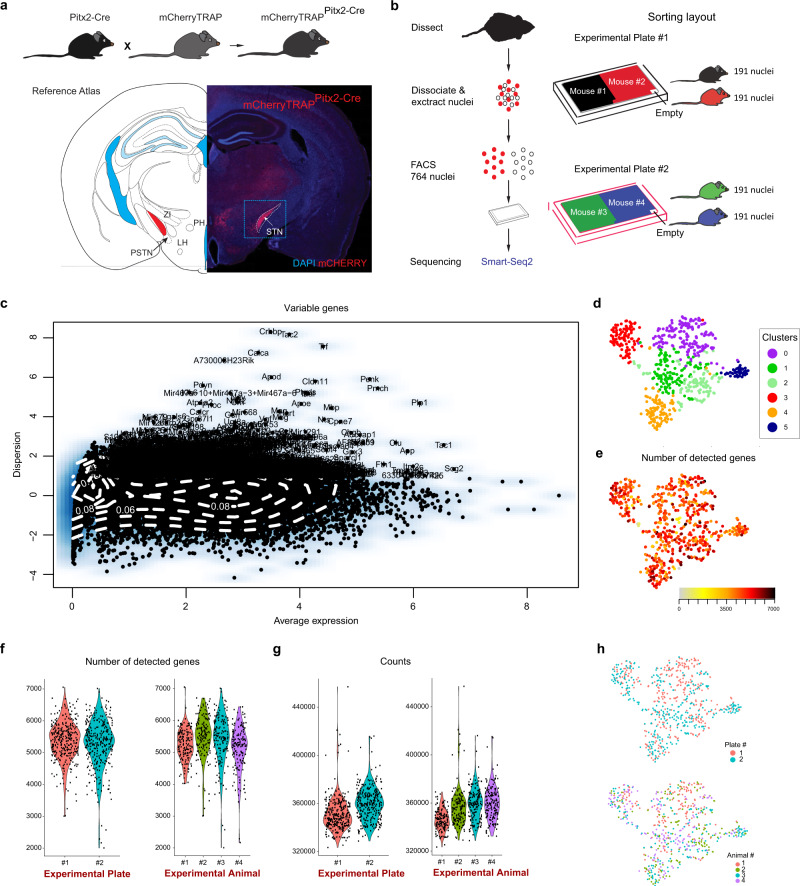
Fig. 1. Single-nuclei RNA-sequencing (snRNASeq) of Pitx2-positive cells dissected from the subthalamic nucleus of Pitx2-Cre mice identifies six gene clusters.
a Schematic illustration of breeding strategy of Pitx2-Cre mice and mCherryTRAP reporter mice to generate mCherryTRAPPitx2-Cre mice. mCherry-fluorescence detected in the STN of mCherryTRAPPitx2-Cre mice; gross outline of dissected region shown in square (dotted lines). Also hypothalamic neurons in vicinity show mCherry fluorescence. Reference Atlas refers to illustration modified from published atlas;54 red area corresponds to the STN. b Schematic illustration of experimental procedure from dissection to sequencing. c Identification of highly variable genes. The dispersion of the genes (variance/log-average expression) is plotted against the average expression (normalized log-expression, on x-axis). The minimum threshold to be considered highly variable was set at a dispersion of 1 on the y-axis. d t-SNE with six clusters (purple cluster0; green cluster1; light-green cluster2; red cluster3; orange cluster4 and blue cluster5). e Number of detected genes per nuclei (expression levels ranging from light gray (low) to black (high). f Violin plots showing the number of detected genes of each nuclei across the two experiment plates according to Seurat unsupervised clustering. g Violin plots showing the average number of transcripts across the two experiment plates. h tSNE-plots colored by experimental plate and by animal (biological replicate). Abbreviations: LH, Lateral hypothalamus; PSTN Parasubthalamic nucleus; PH, Posterior hypothalamus, STN: Subthalamic nucleus; ZI, Zona incerta Source data underlying these plots are shown in Supplementary Data 3.

