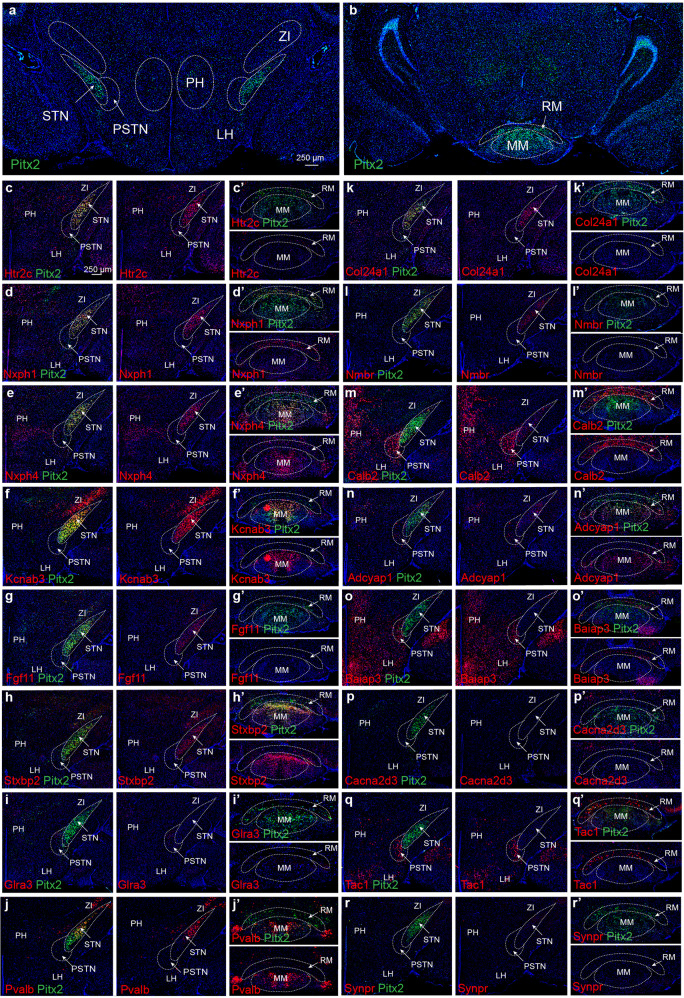
Fig. 3. Fluorescent in situ hybridization (FISH) analysis of Pitx2 and 16 selected mRNAs representing cluster genes from the snRNASeq identifies unique patterns in the STN, PSTN and neighboring areas.
a, b Pitx2 mRNA primarily detected in the STN but also seen in the PSTN, LH, PH, ZI, MM and RM. c–r FISH analysis of Pitx2 mRNA (green) combined with 16 selected markers (red) within the STN, PSTN, ZI, LH and PH (in order presented: Htr2c; Nxph1; Nxph4; Kcnab3; Fgf11; Stxbp2; Glra3; Pvalb; Col24a1; Nmbr; Calb2; Adcyap1; Baiap3; Cacna2d3; Tac1; Synpr mRNAs). Regional distribution detected for all mRNAs in the ventral diencephalic areas assessed. All mRNAs found in the STN except Baiap3, Cacna2d3, Glra3, Tac1, Synpr. All mRNAs in the STN co-localize with Pitx2. Co-localization of mRNA with Pitx2 mRNA is shown in yellow. Scale bar 250 µm. Abbreviations: LH, Lateral hypothalamus; MM, Medial mammillary nucleus; PSTN Parasubthalamic nucleus; PH, Posterior hypothalamus, RM, Retromammillary nucleus; STN: Subthalamic nucleus; ZI, Zona incerta.

