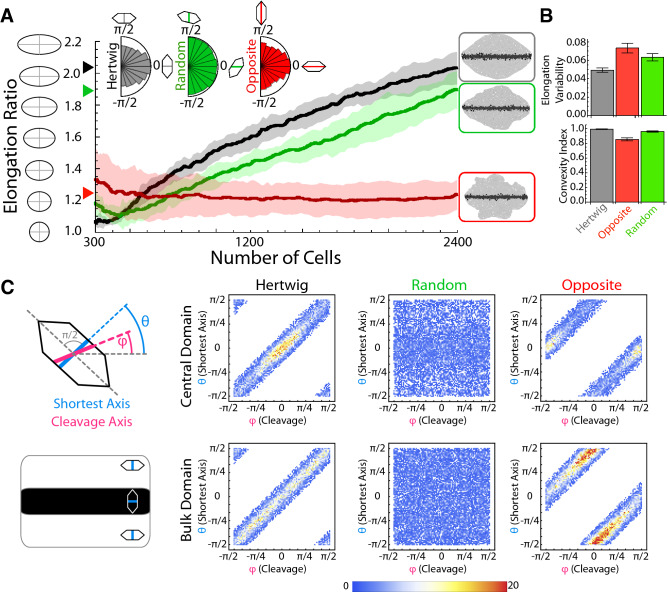
Fig. 3.
Effect of cleavage orientation. (A) Tissue elongation as a function of the number of cells for different cleavage dynamics (ten simulations). Solid lines stand for the mean and the shading for the standard deviation bands. The cumulative polar histograms of cleavage orientations (inset) are a readout of the cellular geometry when the Hertwig rule (black) or its opposite (red) apply but not in the case of random cleavage (green). The Hertwig rule leads to a systematic elongation. The insets show final snapshots of representative simulations depending on the cleavage dynamics. If cells do not divide perpendicularly to their longest axis, then the tissue develops irregularly. (B) The reproducibility of the elongation ratio and the irregularity of the tissue are quantified by the coefficient of variation (standard deviation/mean) of the elongation (last frame) and by the convexity index respectively (bars plot). (C) Analysis of the correlation (cumulative density histograms, all simulation frames and ten simulations) between the cellular geometry prior to division (quantified by the shortest cell axis angle, ) and the cleavage angle () in different tissue domains.

