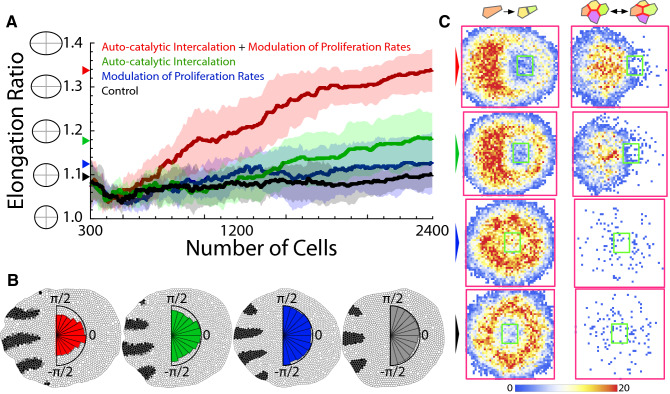
Fig. 5.
Elongation in Turing patterned tissues. (A) Comparison of tissue elongation as a function of the number of cells using different mechanisms (ten simulations): solid lines stand for the mean and the shading for the standard deviation bands. In all cases, cell cleavage follows the Hertwig rule. In control simulation, the mechanical properties of cells are independent of patterning (“Methods”). The final value of the average tissue elongation is indicated by the arrows. (B) Representative snapshots of simulations (same number of cells) and cumulative polar histograms of cleavage orientations (color codes and in A). The black (white) cellular domains account for regions where (). When the auto-catalytic intercalation mechanism applies, cells elongate perpendicular to the direction of axis extension. (C) Cumulative density histograms (all simulation frames and ten simulations) of cell division events (left) and T1 transitions (right) depending on the elongation mechanism (color codes as in A). The green/magenta squares indicate the initial/final bounding box delimiting the tissue size.

