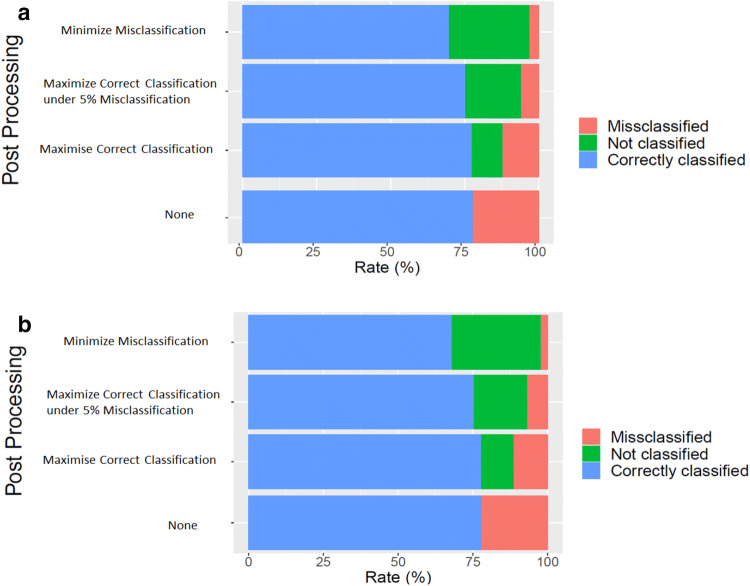
Figure 6.
Benchmark scenario and cross–validation classification rates. We compare results obtained by tuning the thresholds on T2 and using T2 as a testing set (a) and real-life scenario obtained by tuning the thresholds on T1 and using T2 as a testing set (b). For sub-figure: From top to bottom, rates of correct classifications, misclassifications, and unsure classifications for each post-processing: (1) Goal 1: Minimizing misclassification with , (2) Goal 2: maximizing correct classifications under the constraint of having less than 5% of misclassifications, (3) Goal 3: maximizing correct classification with , (4) No post-Processing.

