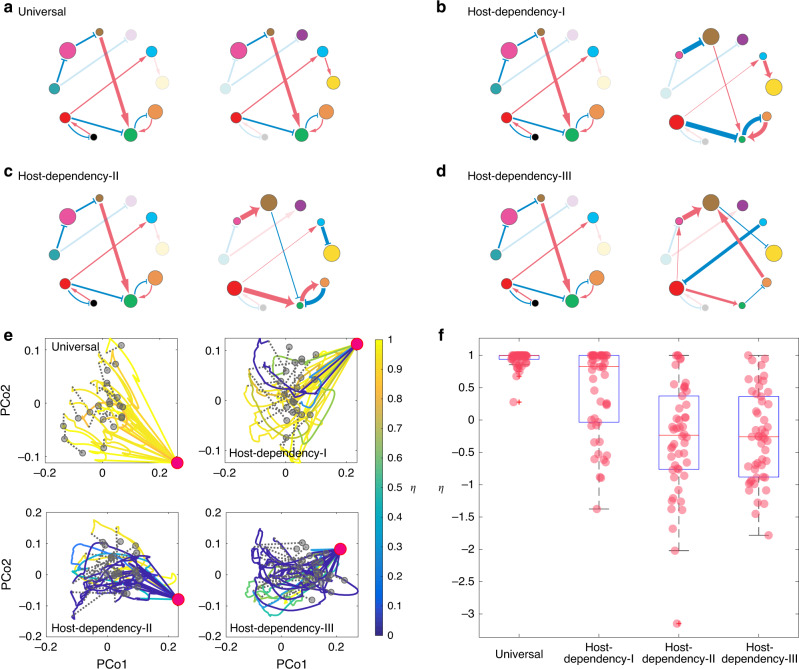
Fig. 3. Impact of host-dependent microbial dynamics on FMT efficacy.
a–d Microbial dynamics with four increasing levels of host-dependency, visualized using the ecological network of the donor’s (left) and recipient’s (right) gut microbiota: a Universal: the two networks are exactly the same. b Host-Dependency-I: they share the same network structure and sign pattern (i.e., interaction types), but have different link weights (i.e., interaction strengths). c Host-Dependency-II: they share the same network structure, but different sign patterns and different link weights. d Host-Dependency-III: they have totally different network structures, different sign patterns, and different link weights. e We performed FMT simulations for each of the four cases (Universal, Host-Dependency-I, Host-Dependency-II, and Host-Dependency-III). In our simulations, we consider a global pool of 100 species, and a particular CDI patient with the diseased state containing only 19 of the 100 species (represented by the red dot in the PCoA plot). We randomly choose 20 healthy donors (represented by the gray dots in the PCoA plot) to perform the FMT for this patient and visualize the time series data of species abundances as trajectories in the PCoA plot, with trajectory color representing the recovery degree evaluated after the recipient’s gut microbiota reaches steady state. Note that η does not naturally belong to [0,1]. For the visualization purpose, we forced η > 1 as η = 1 and η < 0 as η = 0. f The recovery degree decreases with increasing level of host-dependency in the microbial dynamics. The model parameters used in the simulations of panels (e) and (f) are described in Supplementary Note 1. The boxplot is calculated from 50 independent FMT simulations. The central red line indicates the median; the bottom and top edges of the box indicate the 25th and 75th percentiles, respectively. The whiskers extend to the most extreme data points not considered outliers, and the outliers are plotted individually using the cross symbol.

