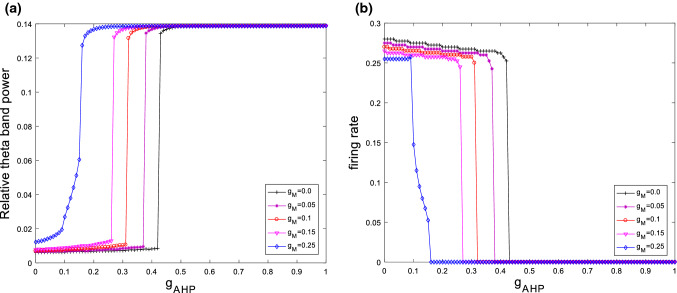
Fig. 12.
The evolution of relative theta band power (a) and firing rate (b) during the increase of the ionic conductance for different when . It can be seen that for different the relative theta band power always first increases and then approaches its maximum at a critical value as is increased. Moreover, the firing rate first slightly decreases and then abruptly decreases to zero

