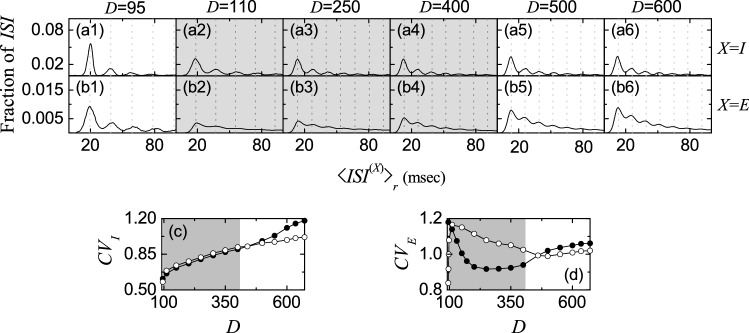
Fig. 10.
Characterization of individual spiking behaviors in the presence of interpopulation (both I to E and E to I) STDPs. ISI histograms for various values of D in the I-population (a1–a6) and the E-population (b1–b6). Vertical dotted lines in a1–a6 and b1–b6 represent multiples of the global period of the instantaneous population spike rate ( or E). Plots of the coefficient of variation (open circles) versus D; cI and dE. For comparison, the coefficients of variation in the absence of STDP are represented by solid circles

