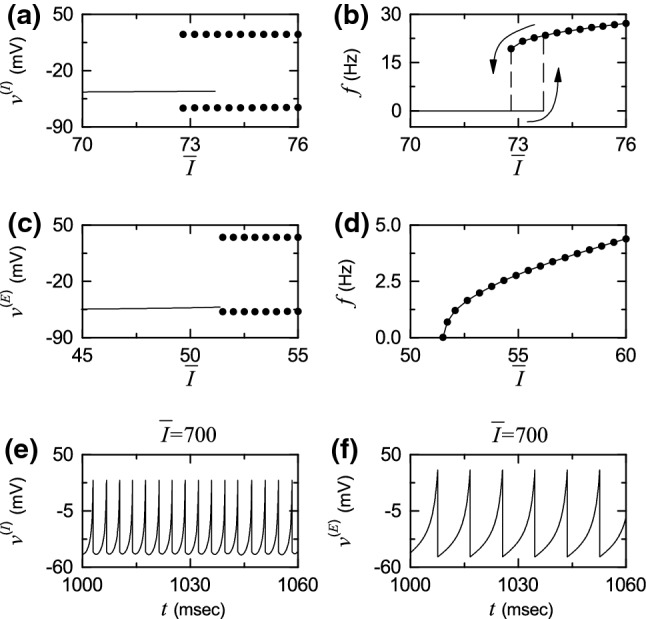
Fig. 2.

Single Izhikevich fast spiking interneuron for : a bifurcation diagram (i.e., plot of versus the time-averaged constant of the external input ) and b plot of the mean firing rate f versus . Single Izhikevich regular spiking pyramidal cell for : c bifurcation diagram (i.e, plot of versus ) and d plot of f versus . In a, c, solid lines denote stable equilibrium points, and solid circles represent maximum and minimum values of the membrane potential ( or E) for the spiking states. Time series of the membrane potential of e the Izhikevich fast spiking interneuron and f the Izhikevich regular spiking pyramidal cell for
