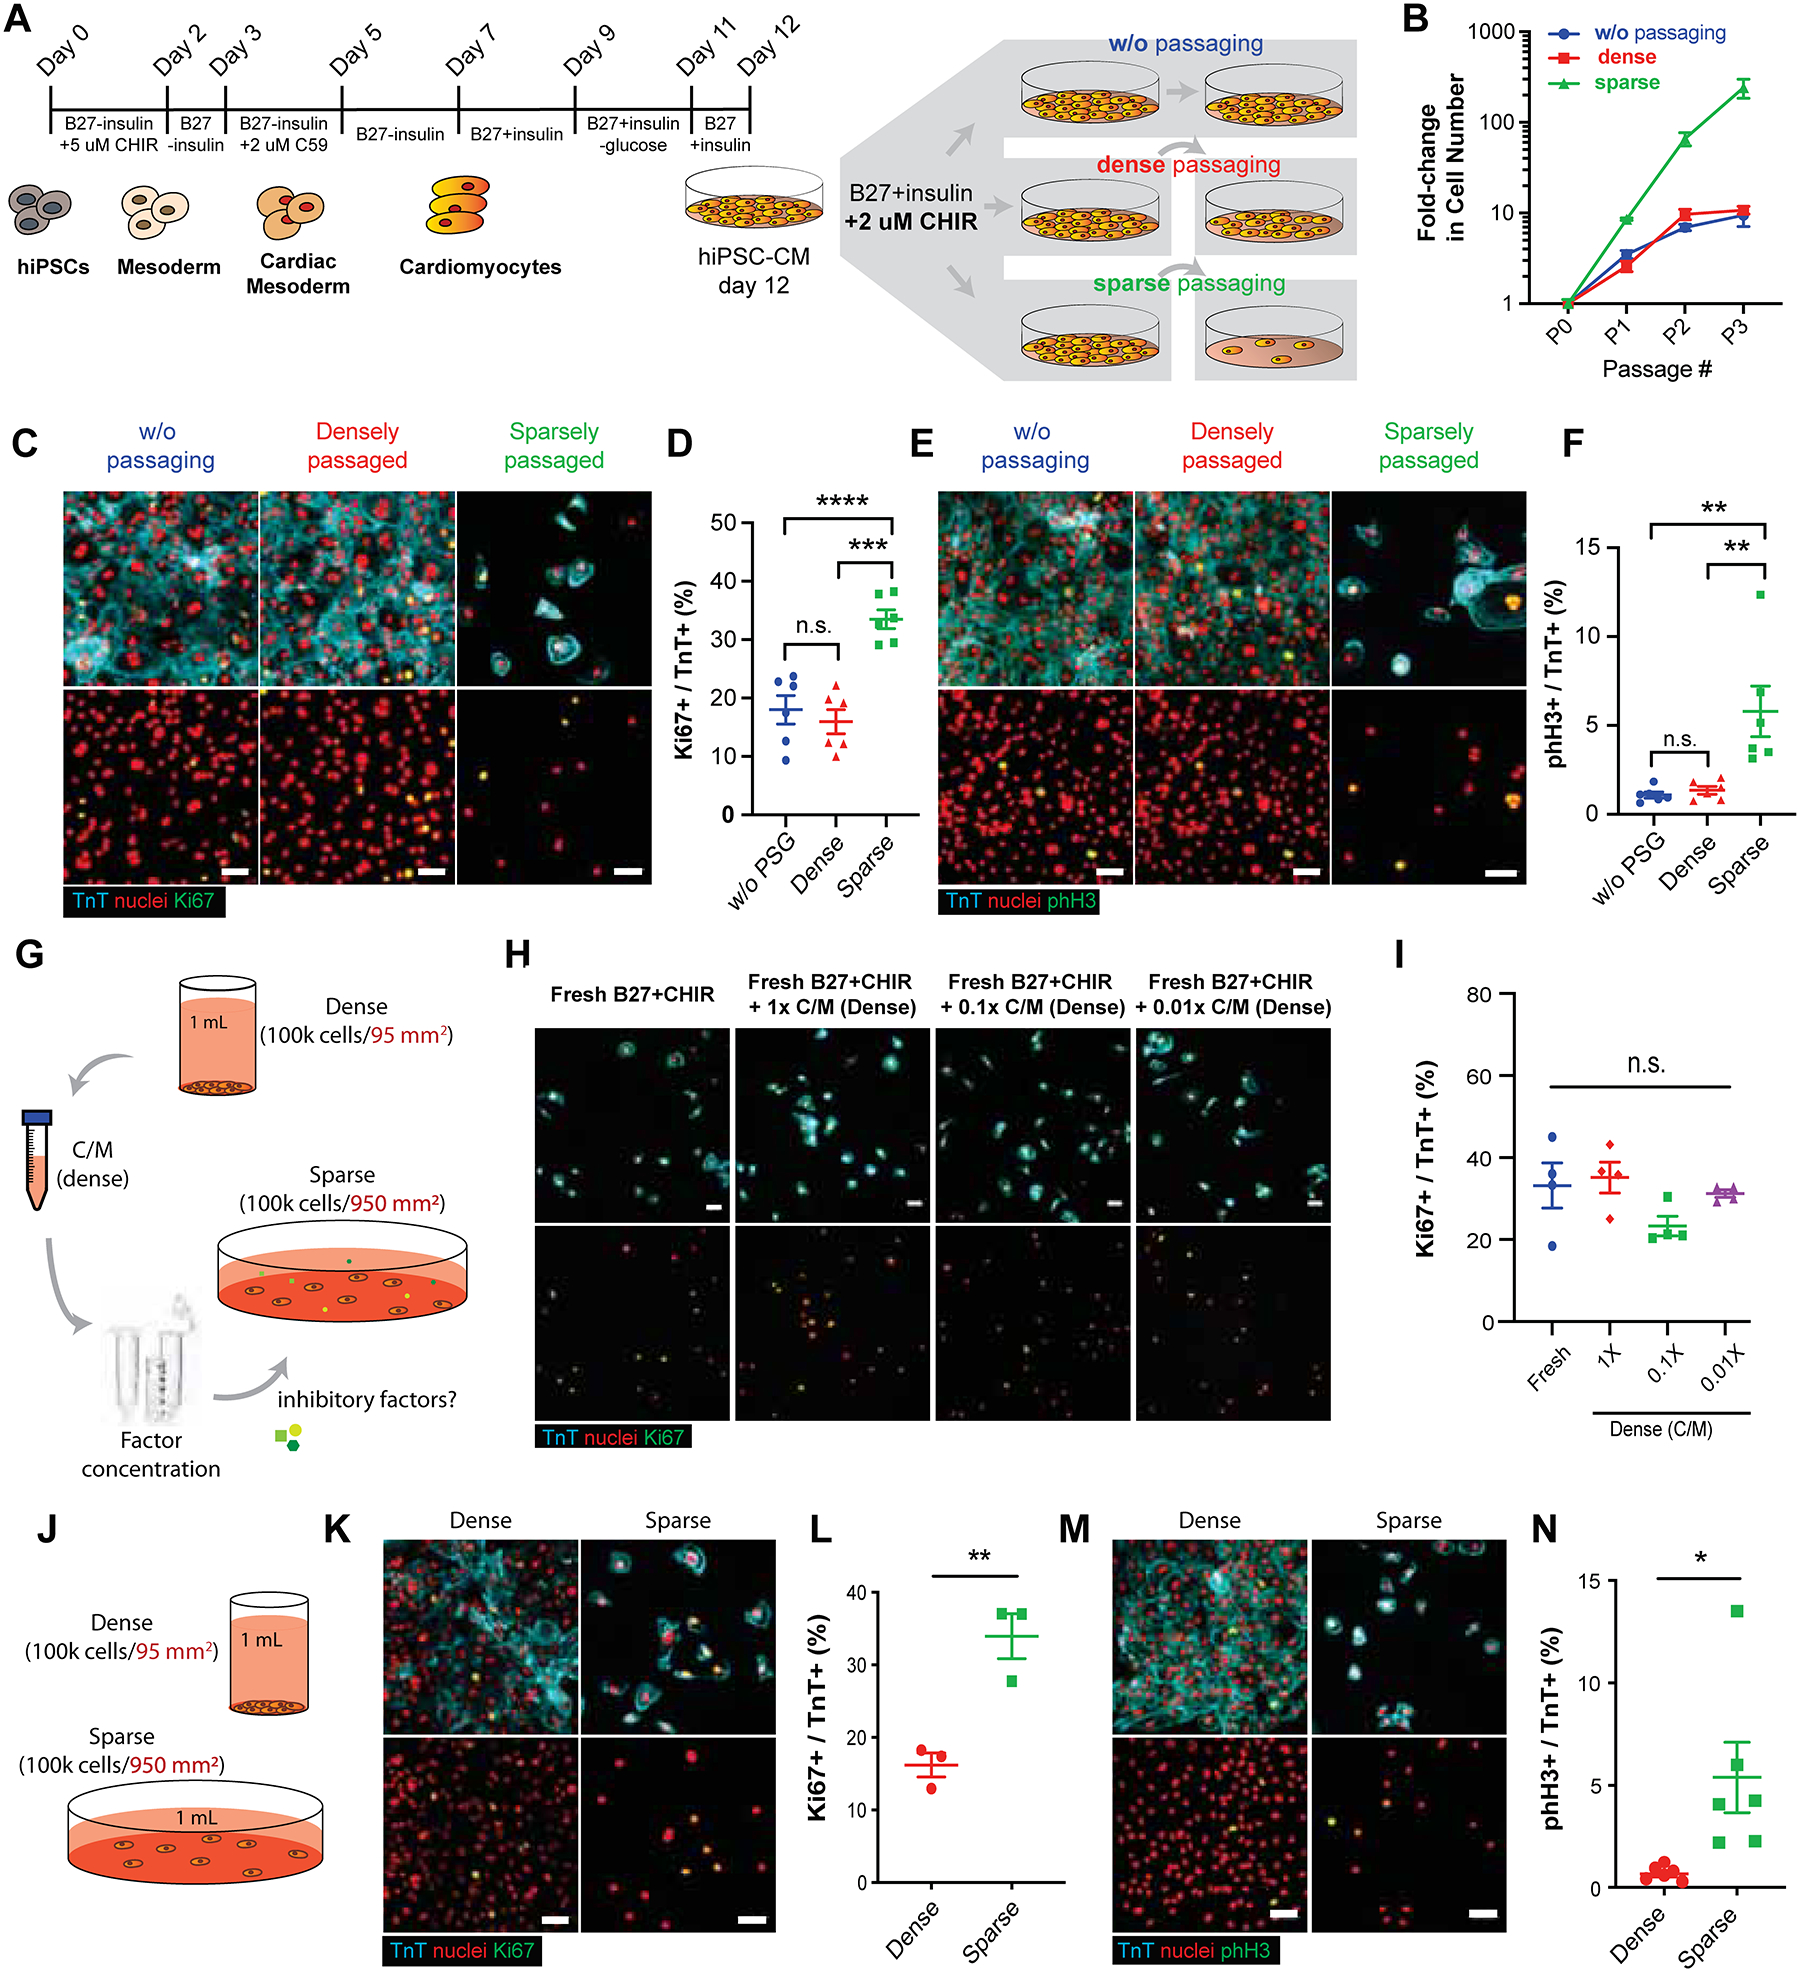
Figure 1:

GSK-3β inhibition promotes hiPSC-CM proliferation in a cell-density dependent manner. (A) Schematic of Wnt-modulated directed cardiac differentiation and subsequent expansion. Day 12, hiPSC-CMs were plated densely (~100,000 cells/cm2), sparsely (~10,000 cells/cm2) for serial passaging or cultured without passaging (~500,000–1M cells/cm2) in the presence of CHIR99021 (CHIR) (2.0 μM). (B) Expansion of hiPSC-CMs represented as fold increase over day 12 for each passage (P) number. (C) Immunofluorescence images and (D) the quantification of proliferation marker Ki67 (green), cardiac troponin T (TnT) (cyan) and nuclei (red) in hiPSC-CMs. (E) Immunofluorescence images and (F) the quantification of mitotic cardiomyocytes assessed by phospho-histone H3 (pHH3) (green), TnT (cyan) and nuclei (red). (B, D, F) Data are means ± SEM. *p<0.05, ****p<0.001, n.s. p>0.05 by One-way ANOVA with Tukey’s post hoc multiple comparisons test. (G) Illustration of conditioned media collection of densely cultured cells, subsequent factor concentration and application to sparsely cultured hiPSC-CMs. (H) Immunofluorescence images of Ki67 (green), TnT (cyan), and nuclei (red). (I) Quantification of the percentages of Ki67+/TnT+ cells in H. Data are means ± SEM. n.s. p>0.05 by One-way ANOVA Dunnett’s post hoc multiple comparisons to control “no C/M” group (blue circle). (J) Schematic of culturing the fixed number of hiPSC-CMs in dense or sparse condition. (K, M) Immunofluorescence and (L, N) the quantification of the percent (K, L) proliferative cardiomyocytes (Ki67+/TnT+) or (M, N) mitotic cardiomyocytes (pHH3+/TnT+). Data are means ± SEM. *p<0.05, **p<0.01 by unpaired t-test. Supplementary Table 1 specifies the replicates per experiment.
