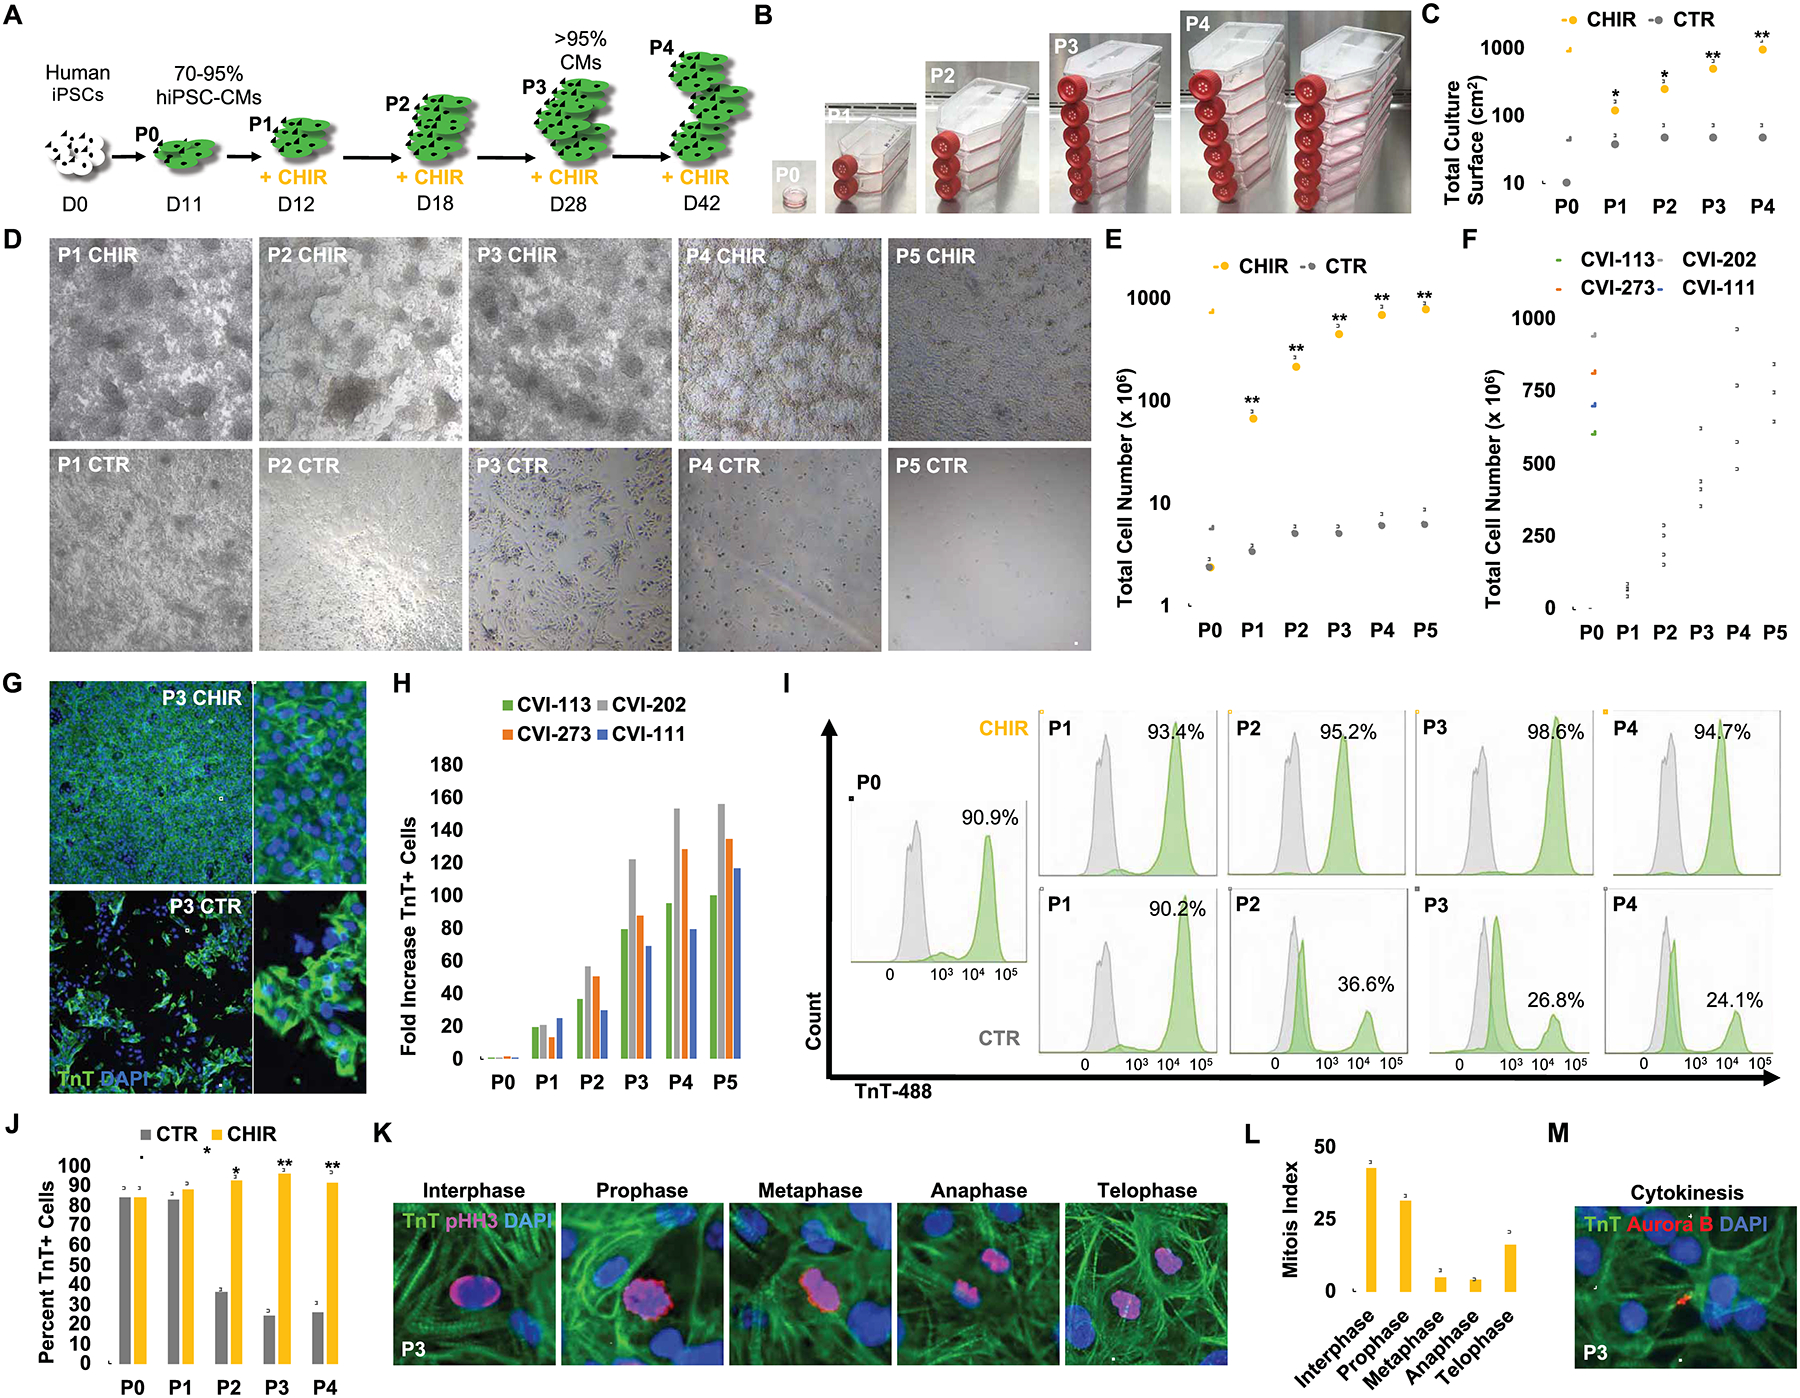
Figure 2:

GSK-3β inhibition and long-term low-density passaging results in massive expansion of beating hiPSC-CMs. (A) Schematic timeline of hiPSC-CM expansion and passaging. (B) Representative images of hiPSC-CM flasks from initial 10 cm2 confluent dish at passage 0 (P0) to multiple T-175 cm2 cell culture flasks at end of passage 4. (C) Total surface area (cm2) coverage by hiPSC-CMs at each passage. (D) Representative bright-field images of hiPSC-CMs treated with CHIR (2.0 μM) or DMSO (CTR) prior to being passaged. Note that CHIR-treated cells reach confluence again prior to next passaging while DMSO-treated cells become progressively more sparse. Same dilution factor was applied to both treatment conditions. (E) Quantification of total cell numbers from P0 to P5. (F) Graph displaying the expansion for multiple passages (P) of low-density cultured and CHIR treated CMs derived from four different hiPSC lines. (G) Immunofluorescence analysis for TnT expression at P3 for hiPSC-CMs treated with DMSO (CTR) or CHIR. (H) Fold increase in TnT+ cells at each passage in CHIR-treated over DMSO treated cells for 4 indicated hiPSC lines. (I) Representative flow cytometry plots of TnT expression (green) and unstained controls (grey) in DMSO (CTR) and CHIR-treated cells over multiple passaging. (J) Average percentages of TnT+ cells from flow cytometric analysis in (I). (K) Representative confocal microscopy images of P3 (> day 28) CHIR-treated hiPSC-CMs at different phases of mitosis. (L) Quantification of proliferating hiPSC-CMs at distinct mitotic phases from (K). (M) Immunofluorescence image of Aurora B kinase expression in TnT+ cells undergoing cytokinesis. Scale bars represent 100μm, Bar charts represent mean±SD. *p<0.05 and **p<0.005 by unpaired t-test. Supplementary Table 1 specifies the replicates per experiment.
