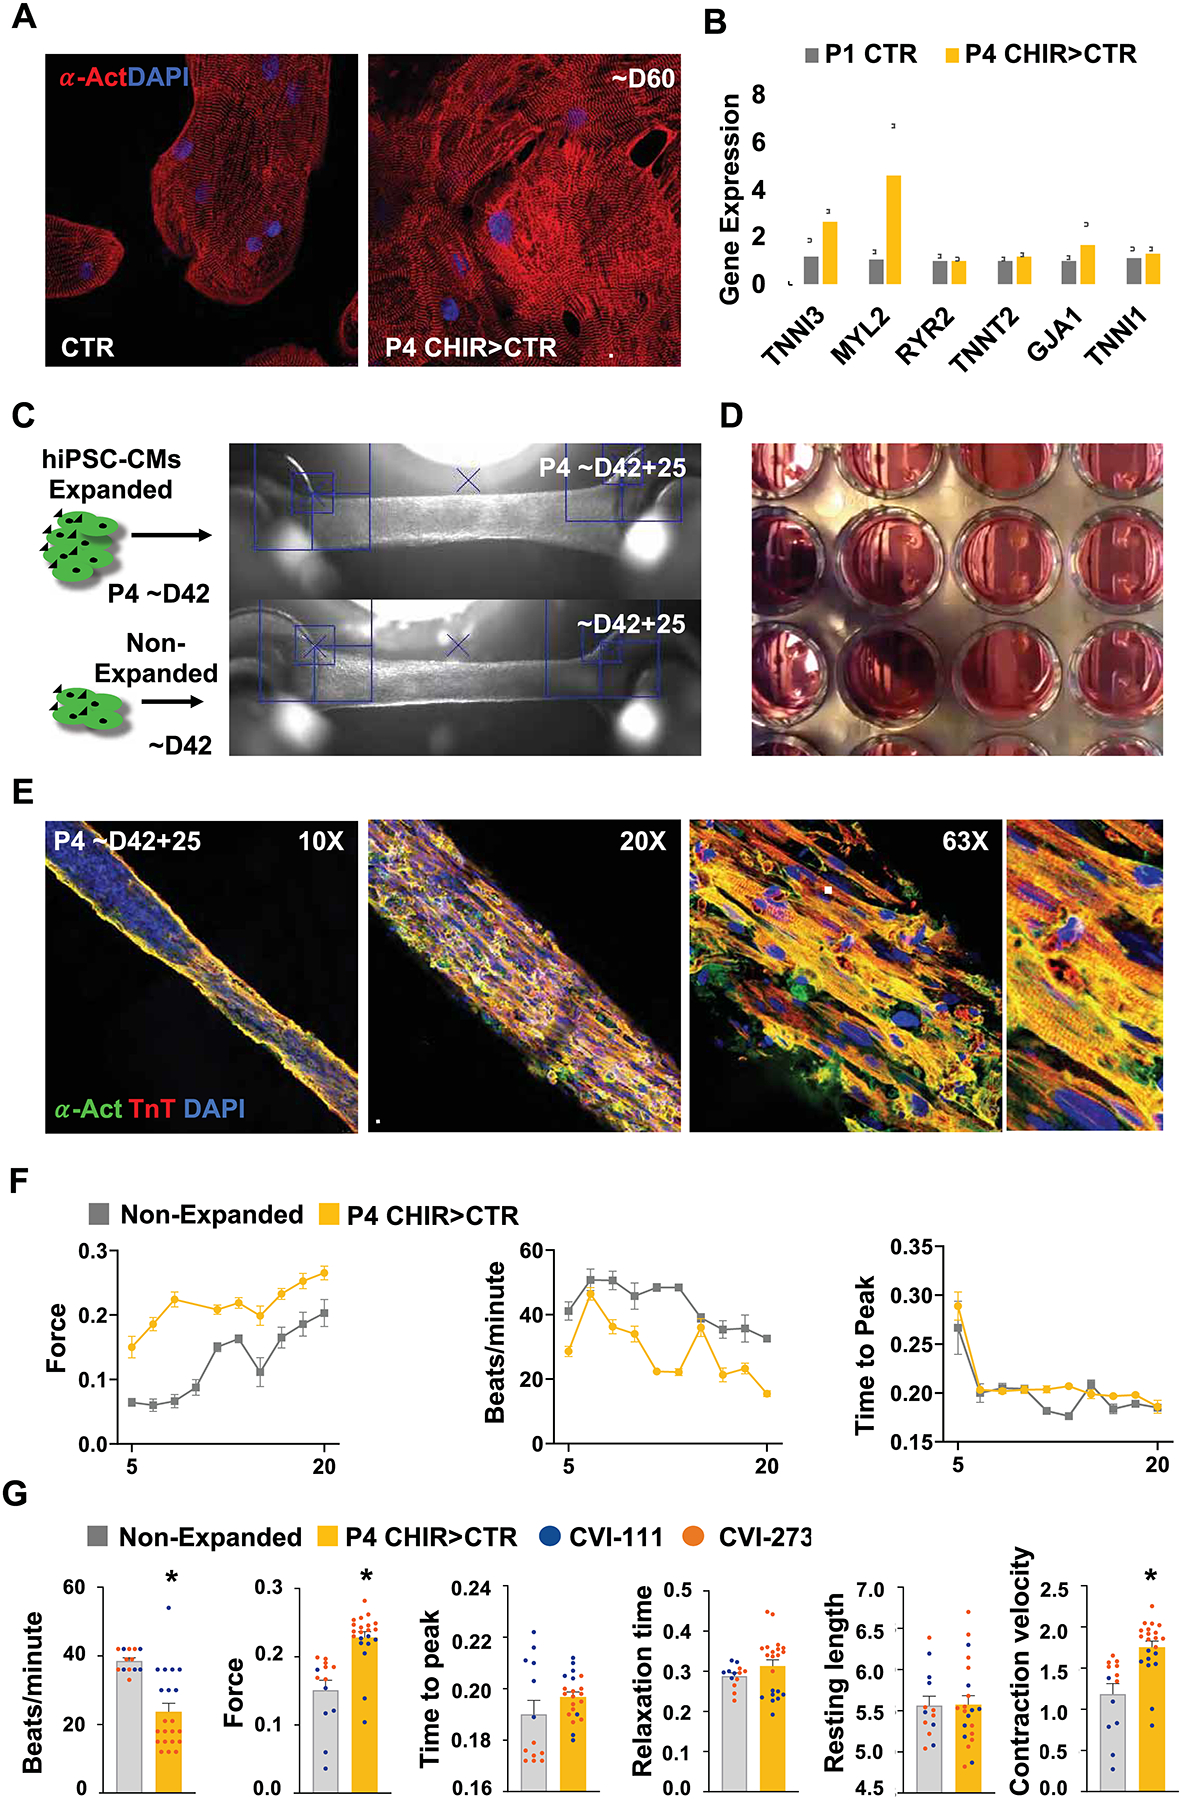
Figure 6:

Long-term GSK3β inhibition with low-density plating does not preclude hiPSC CMs terminal differentiation and maturation in functional cardiac tissue. (A) Immunofluorescence image of alpha-actinin (α-Act) and (B) qPCR analysis of sarcomeric gene expression in passage 4 (P4) expanded vs non-expanded hiPSC-CMs at day 42 (~D42) of differentiation. (C) Brightfield images of engineered heart tissues produced from non-expanded or P4 expanded hiPSC-CMs at ~D42 and further cultured for 25-days. (D) Brightfield image of engineered heart tissues in a 24-well plate format. (E) Immunofluorescence microscopy images of alpha-actinin (α-Act) and Troponin T (TnT) in cardiac tissue generated from previously expanded hiPSC-CMs. (F) Graphs displaying development of contraction force (mN), beating rate and time to peak (T1) in heart tissues generated from previously expanded (P4 CHIR>CTR) (yellow) or non-expanded (grey) hiPSC-CMs measured at time points between day (D) 5 tot 20. (G) Plots for contraction analysis (contraction force (mN), beating rate, time to peak (T1), relaxation time (s), resting length (mm), contraction velocity (mN/s) in engineered heart tissue 14 days after formation for the indicated treatment and hiPSC lines. Scale bars represent 100μm. Bar charts represent mean±SD. Dot plots represents biological replicates and mean±SEM. *p<0.05 by unpaired t-test. Supplementary Table 1 specifies the replicates per experiment.
