Fig. 2.
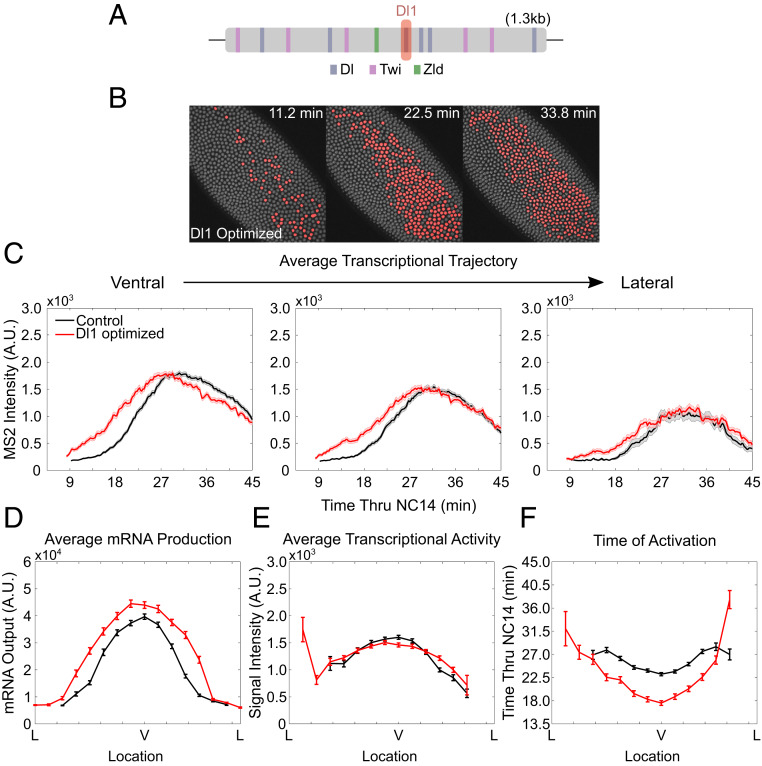
Modulation of a single Dl binding site affects gene expression dynamics. (A) Schematic of t48 enhancer showing the location of Dl, Twi, and Zld binding sites. The Dl1 site is shown in red. (B) Snapshots of t48-optimizedDl1>MS2-yellow embryo at different time points in NC14. Actively transcribing nuclei in a given frame are false-colored. (C) Average trajectory of t48-WT>MS2-yellow (black) and t48-optimizedDl1>MS2-yellow (red) over NC14 of ventrally located nuclei (Left), off-ventral nuclei (Center), and lateral nuclei (Right). (D–F) (D) Average total mRNA production, (E) average transcriptional activity, and (F) average timing of transcriptional initiation of nuclei along the t48 expression domain for t48-WT>MS2-yellow (black) and t48-optimizedDl1>MS2-yellow (red). Only active nuclei were analyzed for C, E, and F; 2,028 nuclei were examined from three biological replicate embryos of t48-optimizedDl1>MS2-yellow embryos. All error bars indicate SEM.

