Fig. 3.
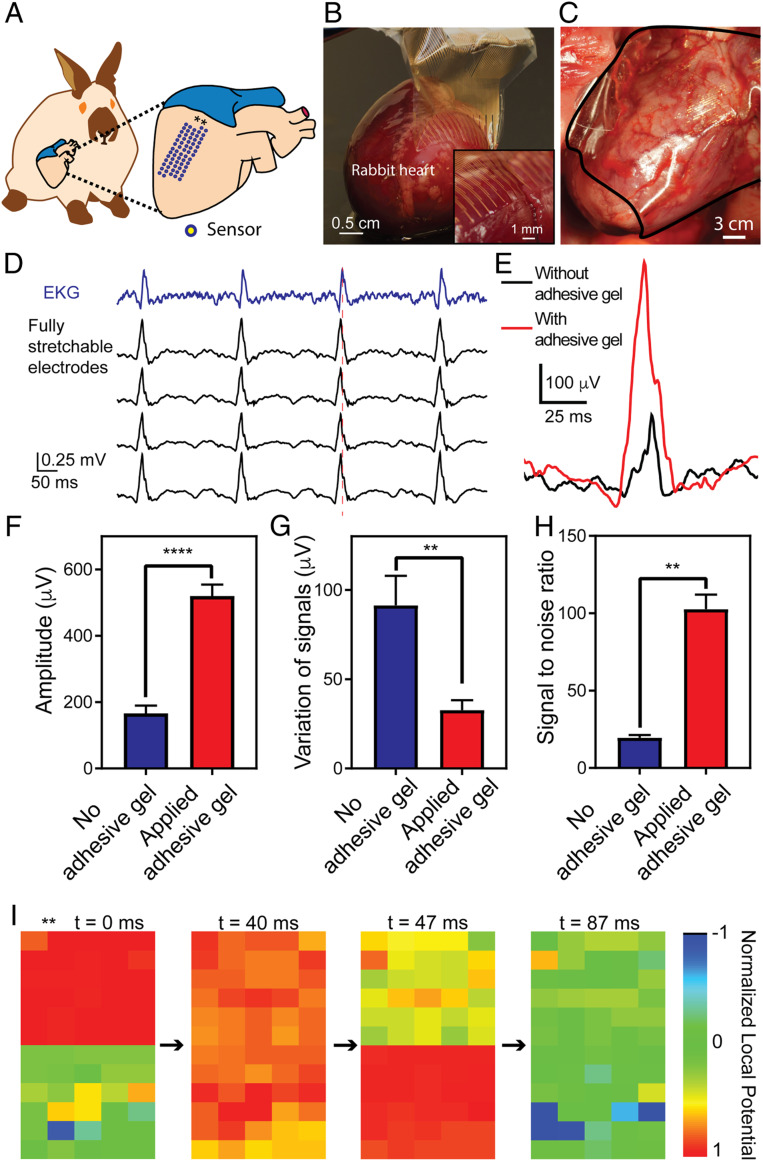
In vivo epicardial recording on rabbit. (A) Schematic showing the relative position of the elastrode array on the surface of a rabbit heart. Stars label the orientation of the elastrode array. (B) Optical photographic image demonstrating the freestanding elastrode array conforming to the surface of superior RV of an ex vivo rabbit heart via surface tension. Inset shows the sensor region conforming on the surface of the heart. (C) Optical photographic image showing the elastrode array conforming to the surface of superior RV of heart from a rabbit through a median sternotomy. The black line highlights the region of the device. (D) Representative voltage traces of the ECG from surface contact leads (black) and electrograms from the elastrode array on the surface of rabbit anterior RV (blue). All 64-channel signals are shown in SI Appendix, Fig. S6. The red dashed line highlights the time delay between ECG and electrogram from elastrode array. (E) Representative single voltage traces showing individual spikes from electrograms before and after applying BOBA gel to enhance the adhesion between the elastrode array and the heart. (F–H) Statistical analysis of amplitude (F), stability (variation of signal amplitude over 1 min) (G), and SNR of signals (H) before and after applying BOBA gel (n = 32). **P < 0.01; ****P < 0.0001. All data are means ± SEM. Statistical analysis was performed by paired t test. (I) Representative normalized voltage data for 60 channels (channels 1 to 30 and 33 to 62 in SI Appendix, Fig. S6) on the elastrode array as their relative position to the heart shown in A at 4 points in time showing a normal cardiac wavefront propagation. Normalized voltage is plotted with the color scale on the right. Stars show the orientation of the elastrode array corresponding to that in A.

