Fig. 5.
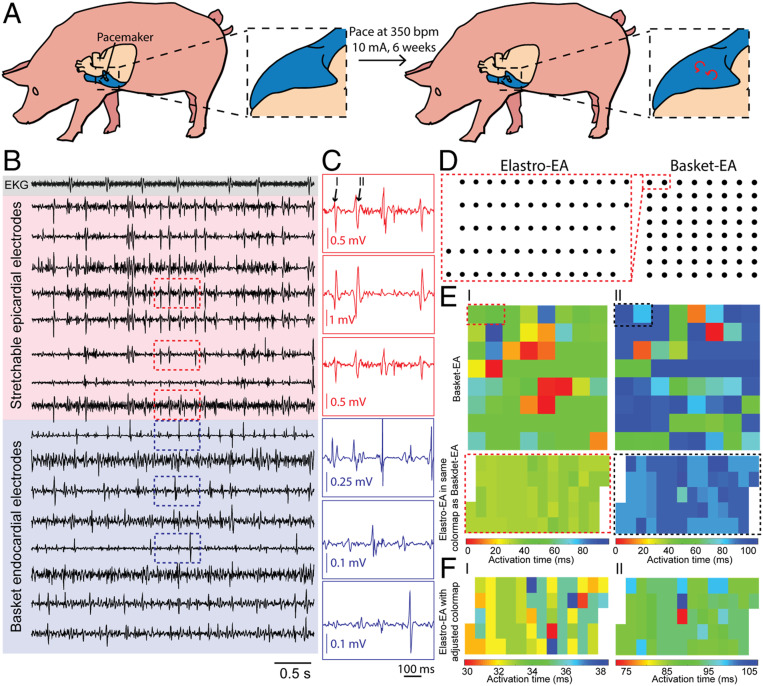
Simultaneous epicardial and endocardial mapping of chronic AF. (A) Schematic showing pacing-induced persistent AF in a porcine model. (B) Representative voltage traces from ECG electrode (gray), epicardial elastrode array (red), and endocardial basket electrode (blue). (C) Representative voltage traces of regions outlined by red and blue dashed boxes in B highlighting the individual peaks (black numbers labeled) that we used to create activation mappings in E. (D) Relative positions of the epicardial elastrode array to endocardial basket electrodes. (E) Isochronal maps of activation time from endocardial basket electrodes (Top) and the epicardial elastrode array (Bottom) from the same temporal reference and scale. Dashed boxes highlight the relative position of the elastrode array to the basket electrode during recording. Each pair of activation maps from the basket electrode and elastrode array is calculated respective to the same temporal reference. Numbers correlate each mapping to the peak highlighted in C. (F) Activation maps of the epicardial elastrode array with adjusted time scale highlighting the local variation of signals. Values on the activation time scale correspond to values in E.

