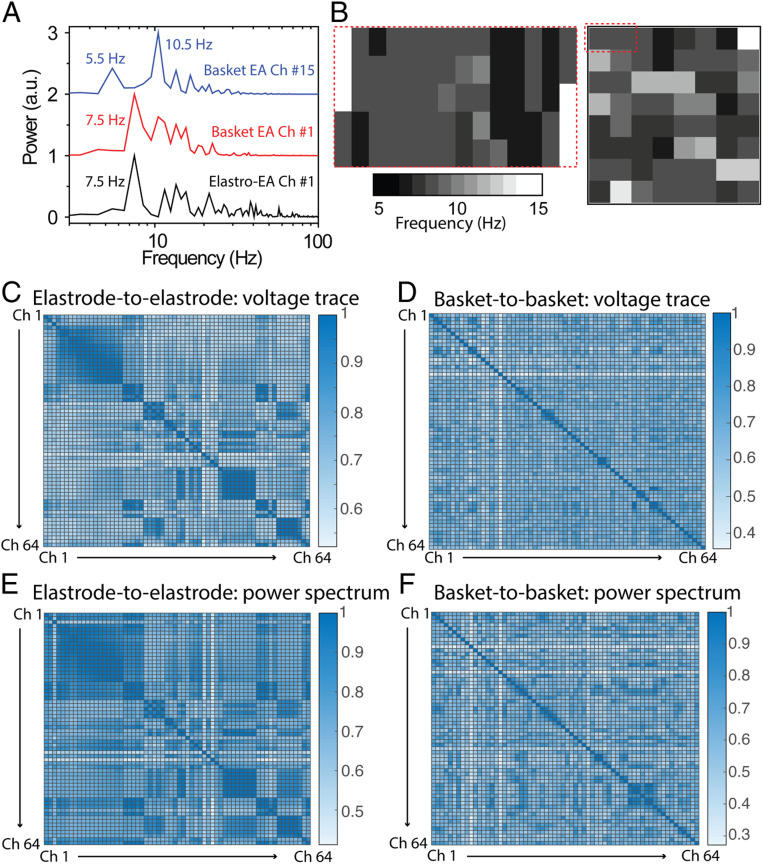
Fig. 6.
Correlation of epicardial and endocardial mapping of chronic AF. (A) Power spectrums of representative epicardial and endocardial signals. (B) Power spectrum mapping of epicardial and endocardial signals. (C–D) Heat plot of the cross-correlation matrix of the raw voltage trace of epicardial signals between each elastrode (C) and each basket electrode (D). (E and F) Heat plot of the cross-correlation matrix of the power spectrum of epicardial signals between each elastrode (E) and each basket electrode (F).

