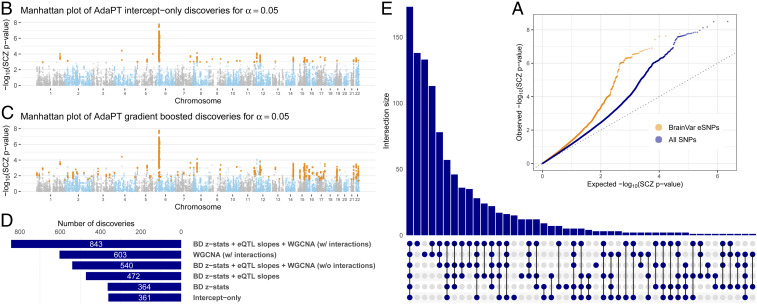
Fig. 2.
AdaPT results from analysis of SCZ P values. (A) Comparison of quantile–quantile plots revealing SCZ enrichment for both BrainVar eSNPs compared with the full set of SNPs from 2014 studies. (B and C) Manhattan plots of SCZ AdaPT discoveries (in orange) using (B) intercept-only model compared with (C) covariate-informed model at target . (D and E) Comparison of the number of discoveries at target for AdaPT with (D) varying levels of covariates and (E) their resulting discovery set intersections.

