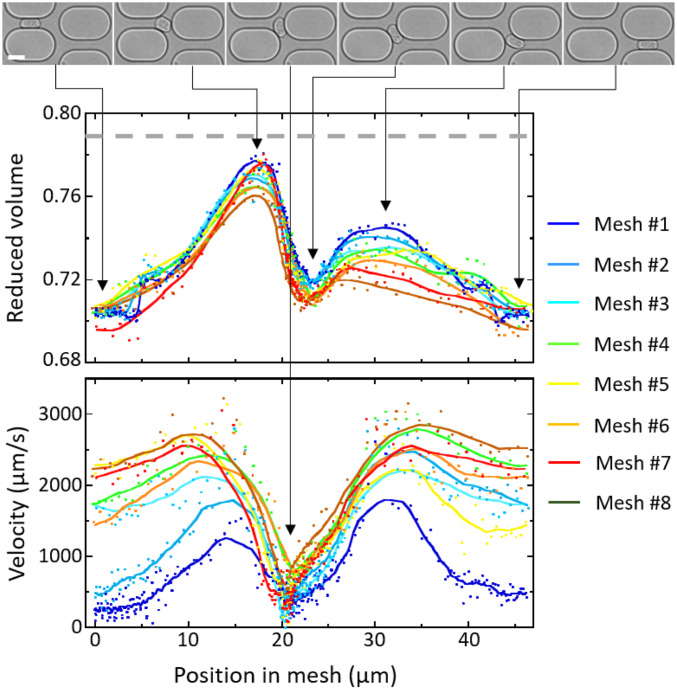
Fig. 2.
Evolution of cell shape and velocity of a 13.2-m cell through the first eight meshes of an 8.6-m channel network, = 40 mbar. Reduced volume (Middle) and instantaneous velocity (Bottom) as function of the cell position in the mesh. The lines are derived from sliding averages over 11 points. Before it enters the network, the cell reduced volume is 0.79 (dashed gray line). (Top) Images of the cell through the first mesh, at minimum and maximum values of , and minimum value of . (Scale bar: 15 m.)

