Fig. 3.
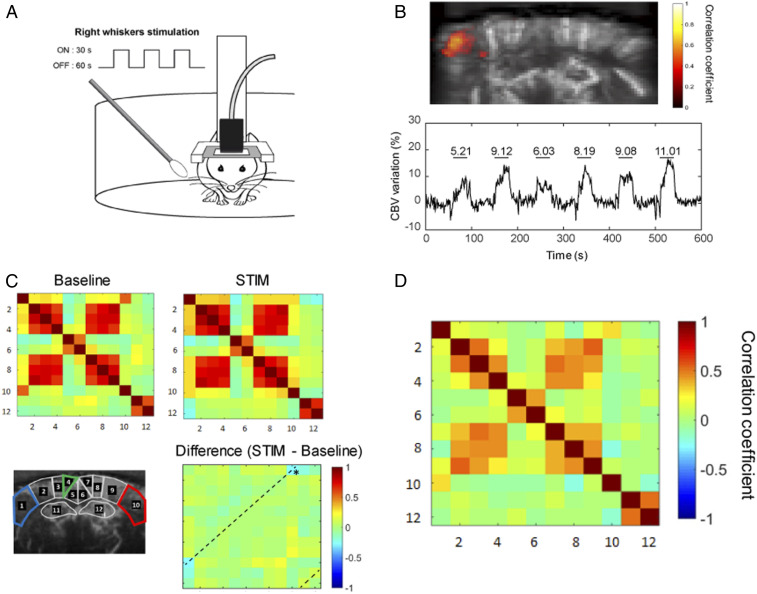
FC changes in awake mice during whisker stimulation. (A, Right) Whiskers were manually stimulated with a cotton swab during 30 s (ON periods) between 60-s rest (OFF periods). (B) Unsupervised correlation map (Upper) showing temporal correlation between the stimulus pattern and the hemodynamic response in a quantitatively representative example. Correlation coefficients (>0.6) for each pixel are overlaid on a gray-scale vascular image. Mean time-series of the activated region (Lower), with horizontal lines representing the ON periods with the mean value for the corresponding relative CBV change in percentage of the baseline. (C) Correlation matrices obtained in n = 6 mice at baseline and during right whisker stimulation (5-min acquisitions, six trials). *P < 0.05 Paired student t test. Whisker stimulation in awake mice was associated with increased locomotion both in ON and OFF periods, inducing global change in CBV leading to elevated overall connectivity. (D) For comparison, mean correlation matrix obtained in n = 6 mice at resting-state epochs.

