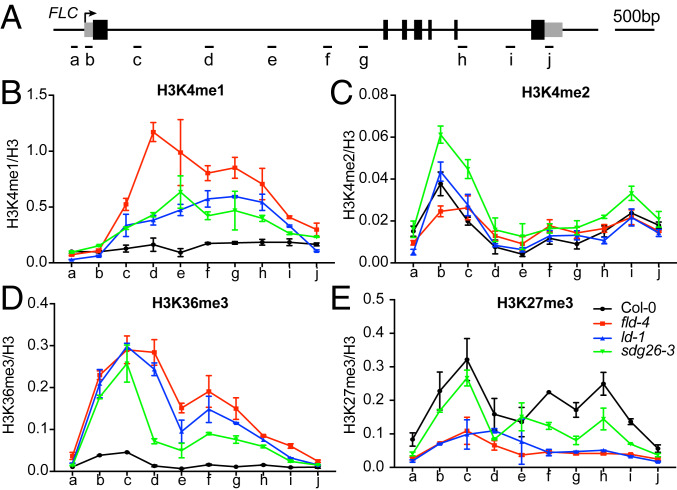
Fig. 4.
Measurements of histone modification levels upon the loss of the FLD/LD/SDG26 complex. (A) Schematic diagram showing FLC gene structure. Gray boxes represent untranslated regions, and black boxes represent exons. The other regions are represented by the black line. The arrow indicates the transcription start site (TSS). Short black lines indicate positions of primers used for qPCR amplification. (B–E) ChIP analysis of H3K4me1 (B), H3K4me2 (C), H3K36me3 (D), and H3K27me3 (E) levels at FLC in various genetic backgrounds. The letters on the x axis correspond to the positions indicated in A. Data are shown as relative to H3. Values are means ± SEM from three independent biological replicates.

