Fig. 2.
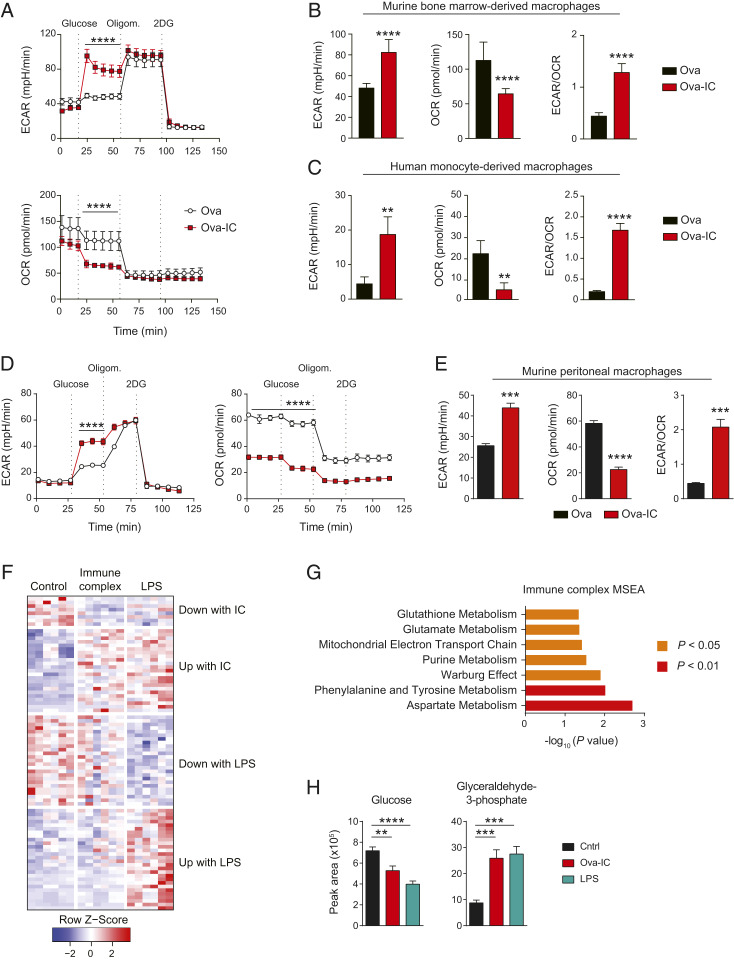
FcγR cross-linking in macrophages results in a switch to aerobic glycolysis. (A) ECAR and OCR in murine BMDMs stimulated with Ova or Ova-IC for 12 h were measured with a glycolysis stress test kit. (B and C) Quantification of ECAR, OCR, and ECAR/OCR ratio in Ova- or Ova-IC–treated murine BMDMs (B) and human MDMs (C) in the presence of glucose. Means ± SEM are shown, and data are representative of three independent experiments. (D and E) ECAR and OCR traces (D) and ECAR, OCR, and ECAR/OCR measurements in the presence of glucose (E) for murine peritoneal macrophages stimulated as in A. Mean ± SEM are shown, and data are representative of two independent experiments (n = 6 to 10 per group). (F) Heat map of differential metabolites in BMDMs stimulated with Ova (control), Ova-IC (immune complex), or LPS for 6 h. (G) Metabolite set enrichment analysis (MSEA) of differential metabolites in Ova-IC versus control macrophages. (H) Peak areas determined by mass spectrometry for glycolysis pathway metabolites altered by IgG IC stimulation in BMDMs stimulated as in F. P values were calculated using a two-way ANOVA (A and D), two-tailed Student’s t test (B, C, E, and H), and MSEA (G; *P < 0.05; **P < 0.01, ***P < 0.001; ****P < 0.0001).

