Fig. 3.
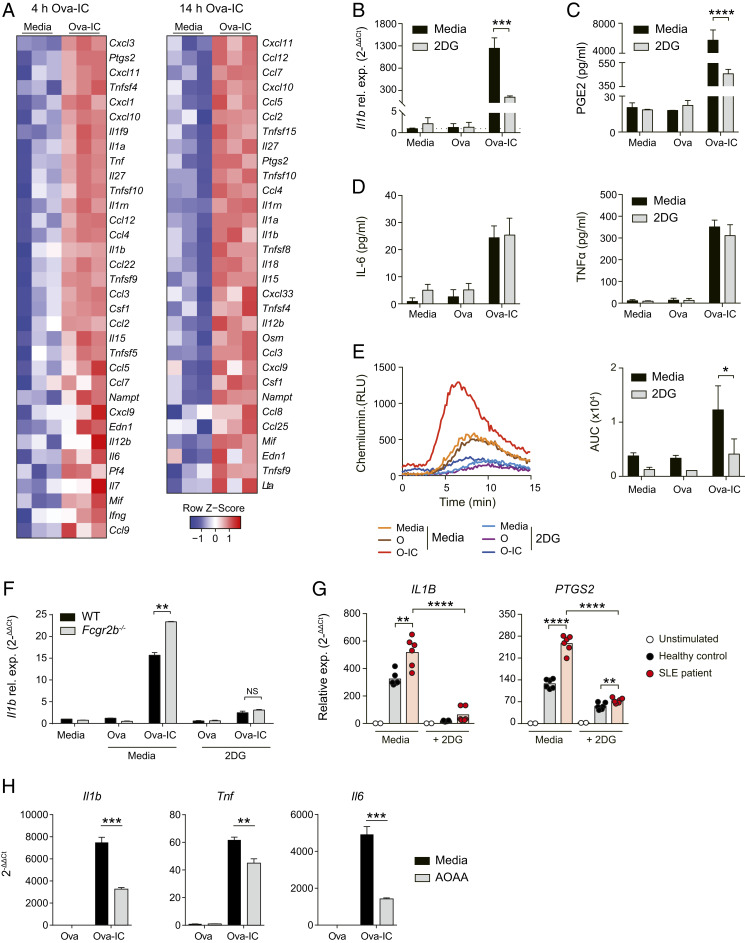
IgG-induced glycolysis is required for macrophage production of inflammatory mediators. (A) Transcriptomic analysis of differentially expressed (P < 0.05) cytokines and chemokines in BMDMs stimulated with Ova or Ova-IC for 4 h or 14 h. (B–D) Quantification of Il1b mRNA expression (B), PGE2 production (C), and IL-6 and TNFα production (D) by murine BMDMs stimulated with Ova/Ova-IC or unstimulated ± 2DG for 6 h. Means ± SEM are shown from triplicate measurements and are representative of three independent experiments. (E) Measurement of ROS production in murine BMDMs stimulated as in B–D for 2 h. Total production of ROS in each group was quantified by calculating the area under the curve (AUC; Right). Means ± SEM are shown from triplicate measurements and are representative of three independent experiments. (F) Quantification of Il1b mRNA production by BMDMs from WT or Fcgr2b−/− mice stimulated as in B–D. Means ± SEM are shown from triplicate measurements and are representative of three independent experiments. (G) qPCR of IL1B and PTGS2 mRNA in human MDMs treated with IgG-IC generated by incubating serum IgG from SLE patients or healthy controls with RNA/Sm antigen with or without the presence of 2DG for 6 h. Data are normalized to unstimulated controls (media) and HPRT1. (H) Quantification of cytokine expression in BMDMs stimulated with Ova/Ova-IC ± AOAA for 6 h. Means ± SEM are shown from four measurements and are representative of two independent experiments. P values were calculated using the two-tailed Student’s t test (*P < 0.05, **P < 0.01, ***P < 0.001, ****P < 0.0001).

