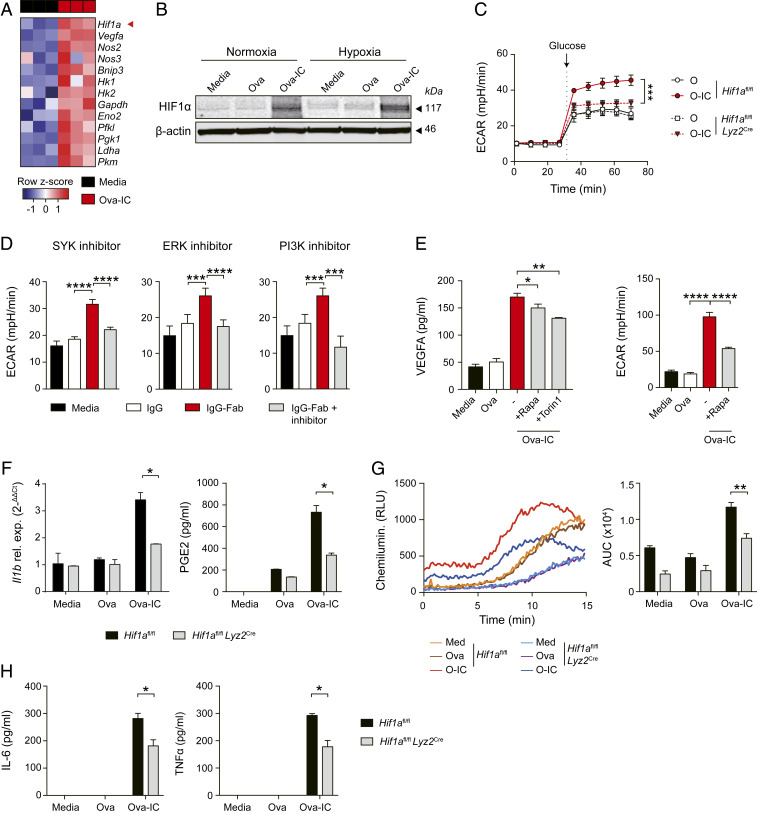
Fig. 4.
HIF1α activation modulates IC-induced glycolysis switch in macrophages. (A) Heat map showing transcriptomic analysis of Hif1a and HIF1α targets genes in murine BMDMs stimulated with Ova-IC or in controls (RPMI) for 14 h. (B) Western blot of HIF1α protein relative to β-actin in murine BMDMs ± Ova-IC stimulation under normoxic or hypoxic conditions. (C) HIF1α-deficient (Hif1afl/fl Lyz2Cre) and control (Hif1afl/fl) BMDMs were stimulated with Ova or Ova-IC for 12 h. ECAR was measured before and after the addition of glucose. (D) ECAR was measured in control (media) or IgG- or IgG-Fab IC-stimulated human MDMs with the presence of small-molecule inhibitors. Macrophages were pretreated with SYK inhibitor (Left), ERK inhibitor (Middle), or PI3K inhibitor (Right) for 1 h and stimulated with IC (IgG-Fab) for 20 h. (E) Quantification of VEGFA in supernatants (Left) and ECAR (Right) from murine BMDMs stimulated with Ova, Ova-IC, or control (media) with or without the presence of mTOR inhibitors for 6 h. (F) Quantification of Il1b mRNA and PGE2 from HIF1α-deficient (Hif1afl/fl Lyz2Cre) and control (Hif1afl/fl) BMDMs stimulated with Ova, Ova-IC, or control (media) for 6 h. (G) Measurement of ROS production in BMDMs stimulated as in F for 2 h (Left). Total production of ROS in each group was quantified by calculating the area under the curve (AUC; Right). (H) Quantification of IL-6 and TNFα from HIF1α-deficient (Hif1afl/fl Lyz2Cre) and control (Hif1afl/fl) BMDMs stimulated as in F. All graphs show mean ± SEM from triplicate measurements and are representative of three independent experiments. ND, not detected. P values were calculated using a two-way ANOVA (C) or the two-tailed Student’s t test (D–H; *P < 0.05, **P < 0.01, ***P < 0.001, ****P < 0.0001).

