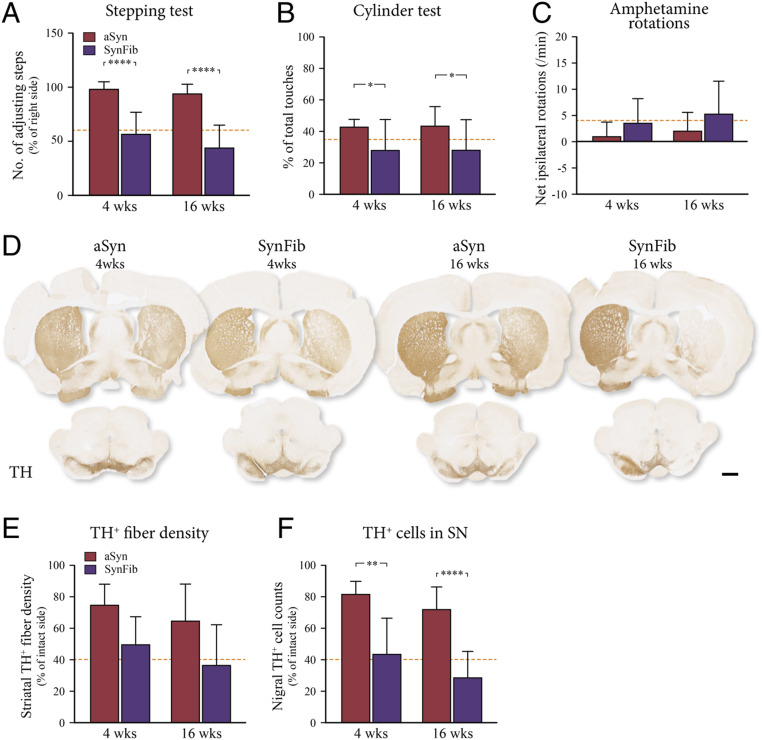
Fig. 1.
Behavioral impairment and TH+ cell and fiber loss. aSyn and SynFib animals were assessed for behavioral impairment using the stepping test (A), cylinder test (B), and amphetamine-induced rotations (C) at both the 4- and 16-wk time points. All animals were immunohistochemically stained for TH to examine the integrity of the dopaminergic system (D). Quantification of TH+ fiber density in the striatum (E) and the number of TH+ cells in the SN (F) are expressed as a percentage of the contralateral side. Dotted lines in A, B, E, and F below the line indicate impairment/loss, whereas in C the impairment is above the line. All data are presented as mean ± SEM. *P < 0.05, **P < 0.01, ****P < 0.0001, compared with the aSyn group at the same time point. (Scale bar, 1 mm.)

