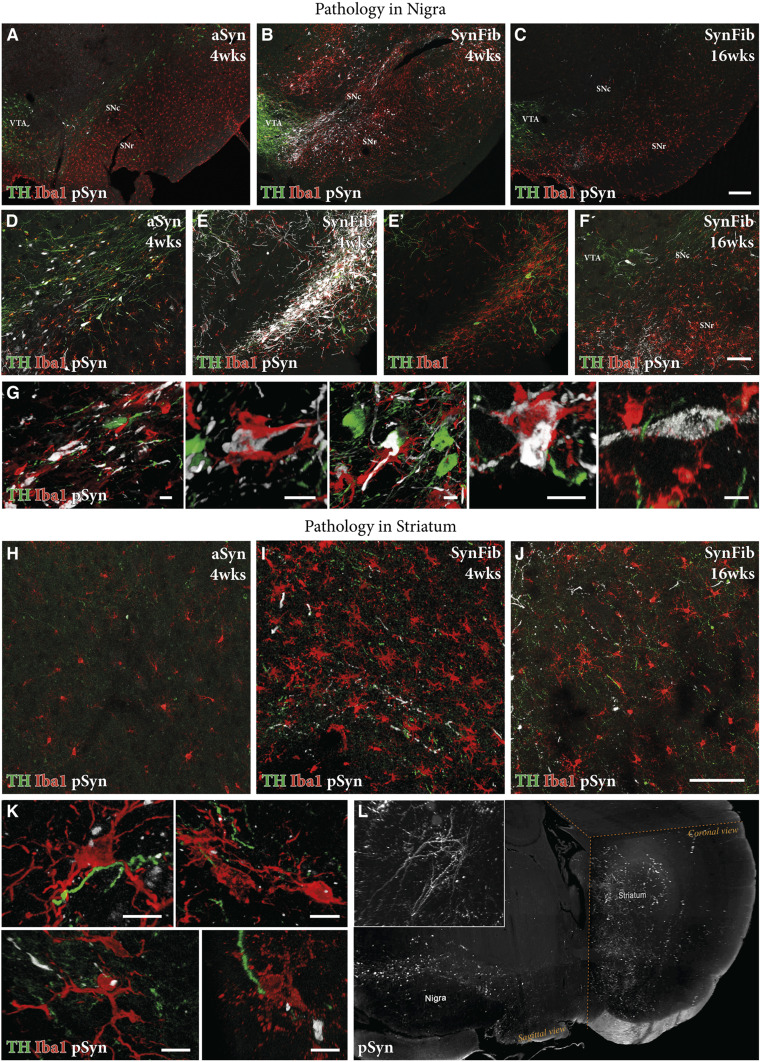
Fig. 2.
Comparison of pSyn pathology and inflammation in the aSyn and SynFib models. Representative photographs of triple-stained nigral sections in the aSyn and SynFib groups show the presence of pSyn pathology (white), activated microglia (red), and TH loss (green) over time (A–C). Higher-magnification images of these are shown in D–F. Examples of colocalization of microglia to cell bodies containing pSyn pathology from SynFib 4-wk animals are shown in G. Representative photographs of the same staining combination in the striatum are shown in H–J. Microglia containing puncta of pSyn+ staining were observed in the striatum, examples of which from the SynFib 4-wk animals are shown in K. The level of pSyn host pathology is difficult to appreciate in two dimensions, although shown in H–J. We therefore performed iDISCO clearing and light-sheet microscopy to demonstrate the dense network of pSyn pathology in SynFib animals. A video of this whole-brain imaging is found in Movie S1, while a still image of this video is shown in L. SNc, substantia nigra pars compacta; SNr, substantia nigra pars reticulata; VTA, ventral tegmental area. (Scale bars, 200 μm [A–C], 100 μm [D–F and H–J], and 10 μm [G and K].)

