Fig. 3.
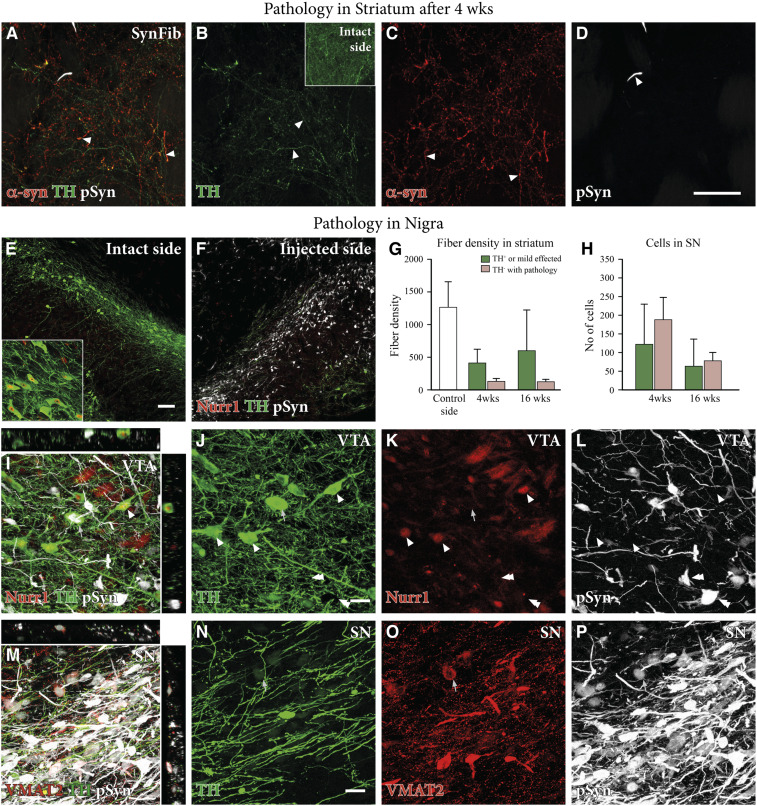
Dopaminergic dysfunction and down-regulation in the SynFib model. Triple staining of striatal tissue for α-syn (red), TH (green), and pSyn (white) shown in A–D indicated that there were a number of TH−, α-syn+ fibers in the striatum, indicating TH down-regulation and quantified in G (n = 6 per group for 4 wk, n = 5 per group for 16 wk, and n = 11 for relative intact side controls). Triple staining of Nurr1 (red), TH (green), and pSyn (white) (E and F) also indicated down-regulation of TH in nigral cell bodies on the injected side, quantified in H (n = 6 per group for 4 wk and n = 5 per group for 16 wk). The same staining in the VTA is shown in high magnification in I–L, with arrowheads indicating TH+, Nurr1+, and pSyn− cells, and arrows indicating TH+, Nurr1−, and pSyn+ cells. VMAT (red), TH (green), and pSyn (white) triple staining of the SN is shown in high magnification in M–P with an arrow showing a TH+, VMAT+, and pSyn+ cell. All data are presented as mean ± SEM. (Scale bars, 50 μm [A–D], 100 μm [E and F], and 20 μm [I–P].)

