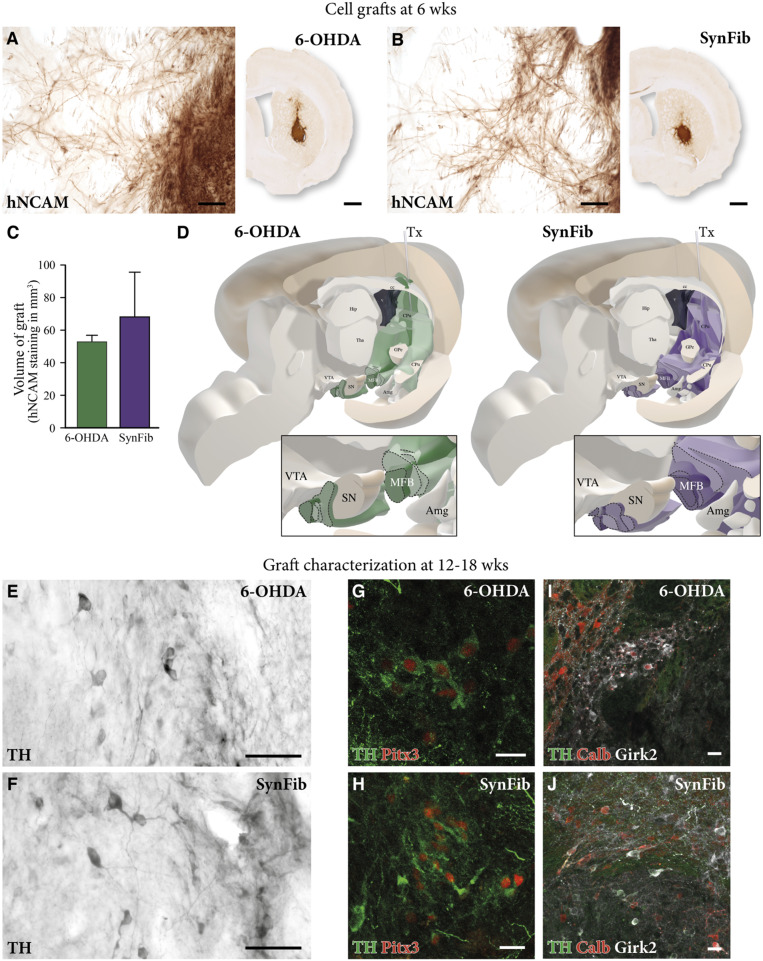
Fig. 4.
hESC-derived DA transplant survival, innervation, and maturation in the SynFib model. hNCAM staining in A and B shows surviving grafts in both the 6-OHDA and SynFib models, and quantified and showing no significant difference in C. High magnification of this staining showing hNCAM innervation of the surrounding striatum is also shown in A and B. This hNCAM innervation was mapped throughout the brain in both models, the pattern and level of which are graphically depicted in D. High-magnification images indicating the maturation of grafts using TH in E and F, TH (green) and Pitx3 (red) in G and H, and TH (green), Calbindin (red), and Girk2 (white) in I and J are also shown. Amg, amygdala; cc, corpus collosum; GPe, globus pallidus; Hip, hippocampus; MFB, medial forebrain bundle; Tha, thalamus; Tx, transplant. All data are presented as mean ± SEM. (Scale bars, 1 mm and 50 μm in high magnification [A and B], 50 μm [E and F], and 20 μm [G–J].)

