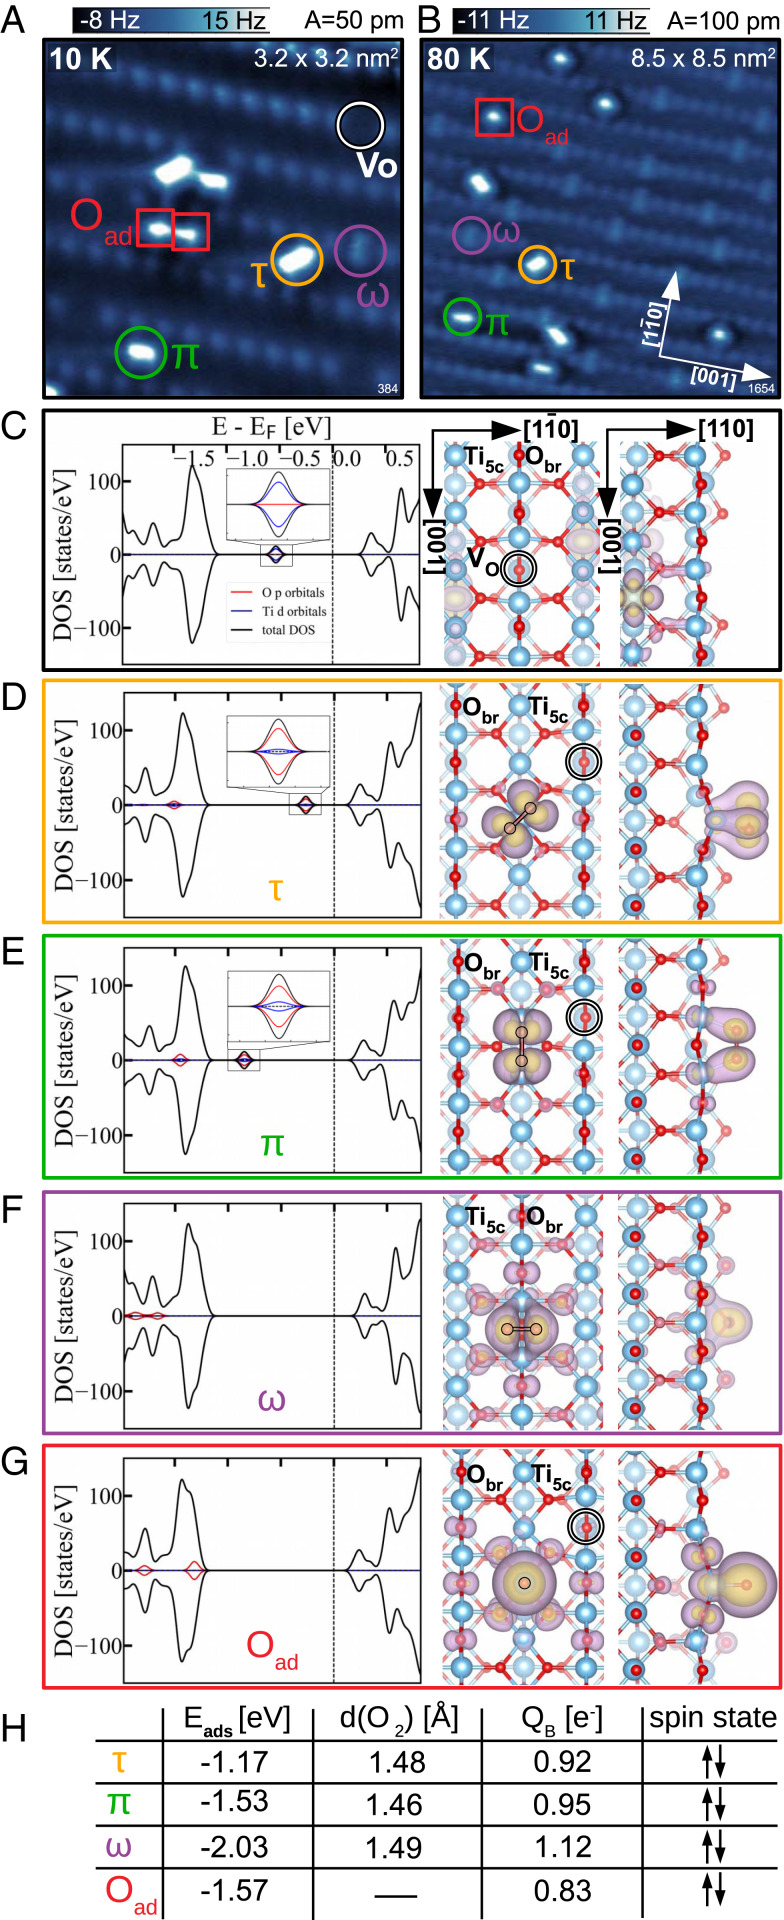
Fig. 1.
Adsorbed molecular and atomic O. (A and B) Constant-height AFM images obtained after dosing at 10 K and 80 K, respectively, showing adsorbed molecular (circles) and atomic O species (squares). (C) DFT calculation of the polaronic ground state of the clean, reduced surface with one bridging-oxygen vacancy. (Left) The total DOS (black) and the partial contributions of the adsorbed O atoms (red) and their nearest Ti atoms (blue). The in-gap state is magnified in Inset. (Right) Partial charge-density plots showing the top and the side view of the charge distribution of the two excess electrons originating from the . (D–G) DFT calculations of the molecular (D–F) and atomic O (G) adsorption configurations marked in constant-height AFM images, together with their respective names in the nomenclature adopted throughout this paper. (H) Table summarizing the adsorption energy and spin states of the adsorbates; O–O bond lengths () and Bader charges of the , , and molecules; and the Bader charge of the oxygen adatom .

