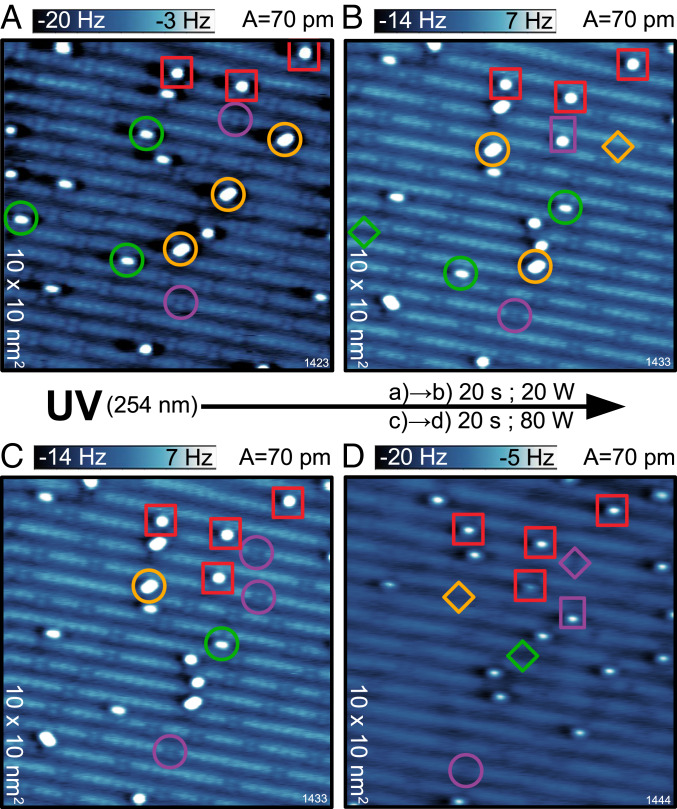
Fig. 4.
Effect of UV light irradiation. (A) AFM image of the surface after exposure at 80 K. The adsorbed species are marked with the same colors and symbols as in Fig. 1. (B) The same region as in A after 20 W UV irradiation for 20 s. The comparison of highlighted species in A and B reveals the reactions after the low-UV dose. Diamonds mark molecular desorption, and rectangles mark dissociation. (C) The same image as in B but with different adsorbates highlighted. (D) The same region as in B and C after additional 80 W UV irradiation for 20 s. The comparison of highlighted species in C and D reveals the reactions after the increased UV dose.

