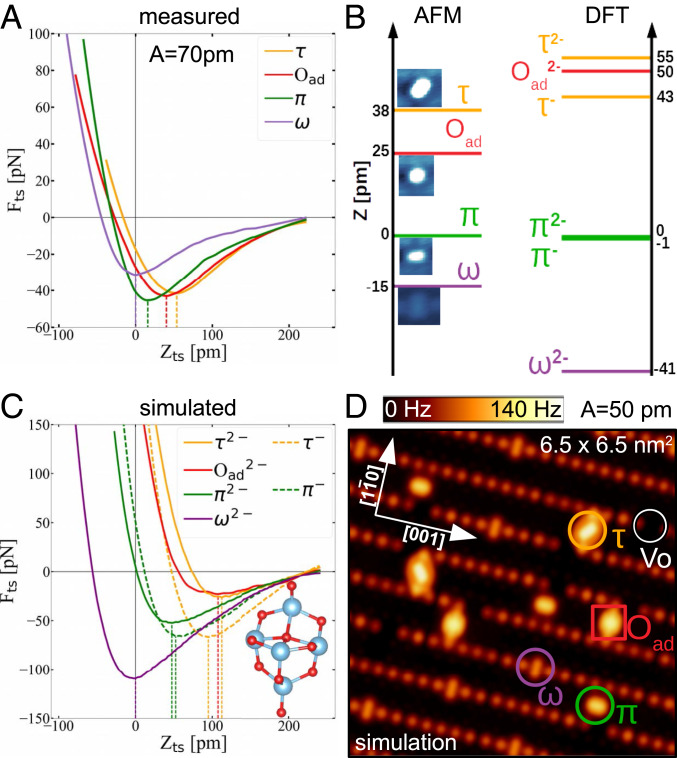
Fig. 7.
Height of the adsorbed species. (A) Experimental force–distance curves obtained above each of the adsorbates. (B) Comparison of the measured height (minimum of , Left) and calculated height (Right) of the adsorbed species. (C) Simulated curves obtained with a nonreactive O-terminated ()5 tip, illustrated in Inset. (D) Simulated constant-height AFM image constructed by the simulated tip-sample forces seen in C.

